
Lesson plans for 8.SP.4
Math · Grade 8 · Statistics & Probability
Understand that patterns of association can also be seen in bivariate categorical data by displaying frequencies and relative frequencies in a two-way table. Construct and interpret a two-way table summarizing data on two categorical variables collected from the same subjects. Use relative frequencies calculated for rows or columns to describe possible association between the two variables.
4 ready-to-teach lesson plans aligned to this standard. Each includes objectives, a materials list, vocabulary and step-by-step activities.

Did It Help? Sorting My Own Stress Moments into a Two-Way Table
Sort your own stress moments to see what helped.

Skip or Stay? A Playlist Two-Way Table on Song Intros
Do short song intros keep listeners? Find out with data.

Which Thumb Is on Top? A Hand-Clasp and Handedness Two-Way Table
Survey hand clasping and handedness in a two-way table.
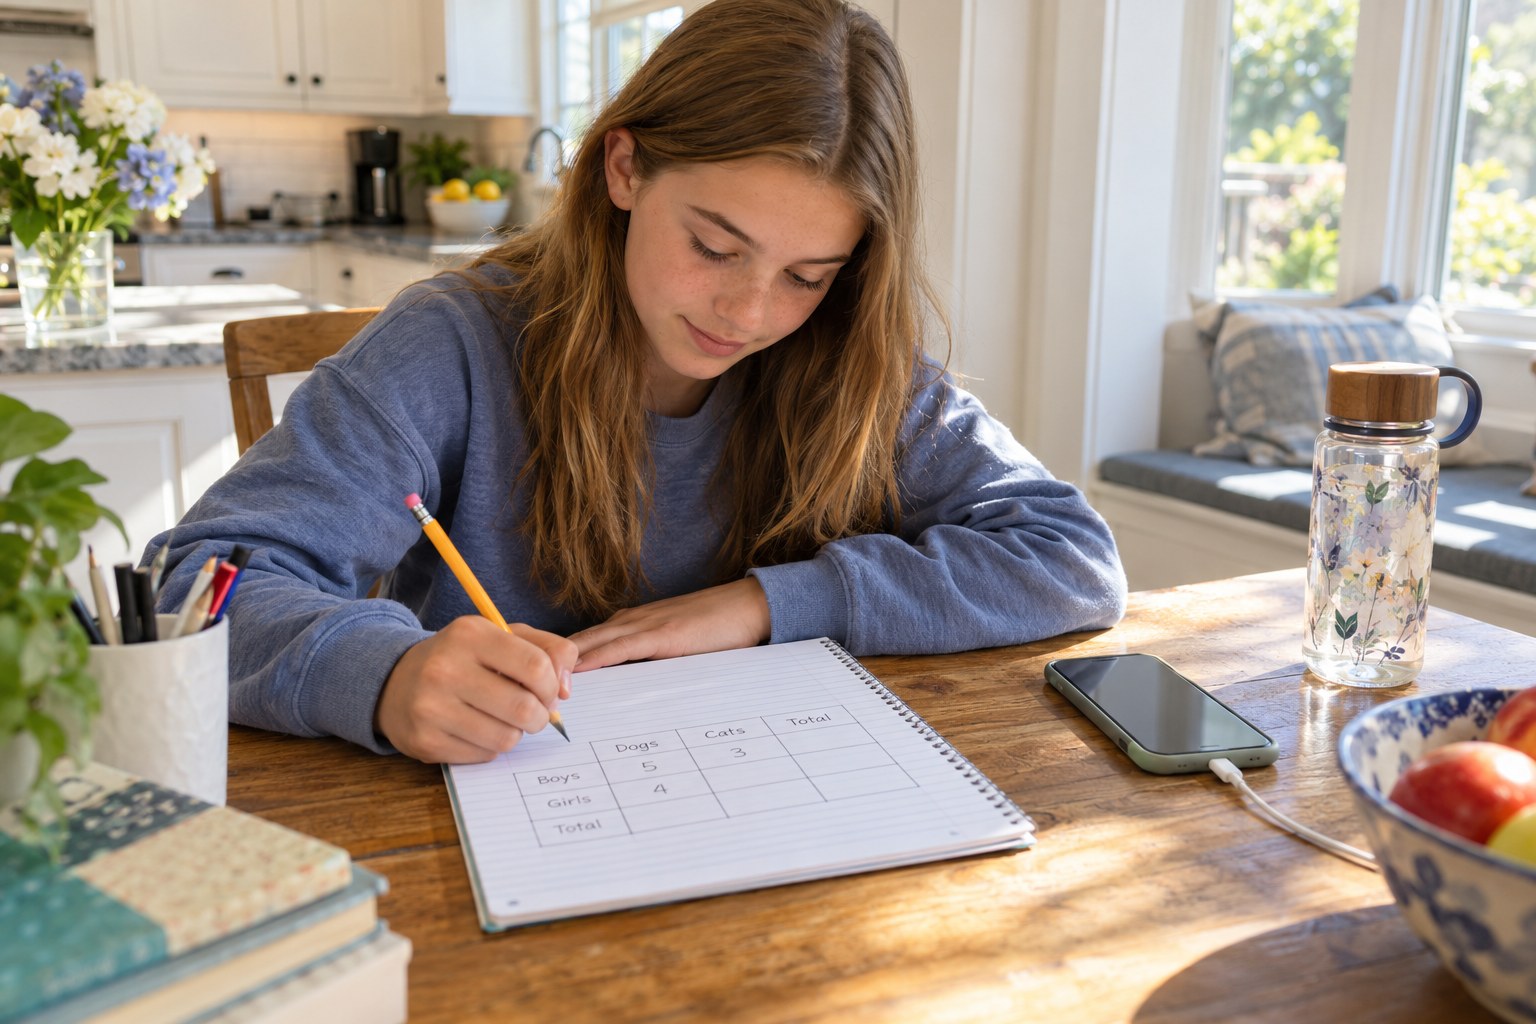
Screens Before Bed: A Family Sleep Survey in a Two-Way Table
Survey family sleep habits and analyze a two-way table.
See all grade 8 standards with lesson plans
Make a lesson like this in a minute
Pick a topic, grade, group size and length. Resource Portal AI writes the objectives, materials, steps and pictures.
Sign up FREEFree forever · no credit card needed. Members get all 5,100+ lessons for $14.99/month, with the first 7 days free.