
Lesson plans for 7.SP.3
Math · Grade 7 · Statistics & Probability
Informally assess the degree of visual overlap of two numerical data distributions with similar variabilities, measuring the difference between the centers by expressing it as a multiple of a measure of variability.
5 ready-to-teach lesson plans aligned to this standard. Each includes objectives, a materials list, vocabulary and step-by-step activities.
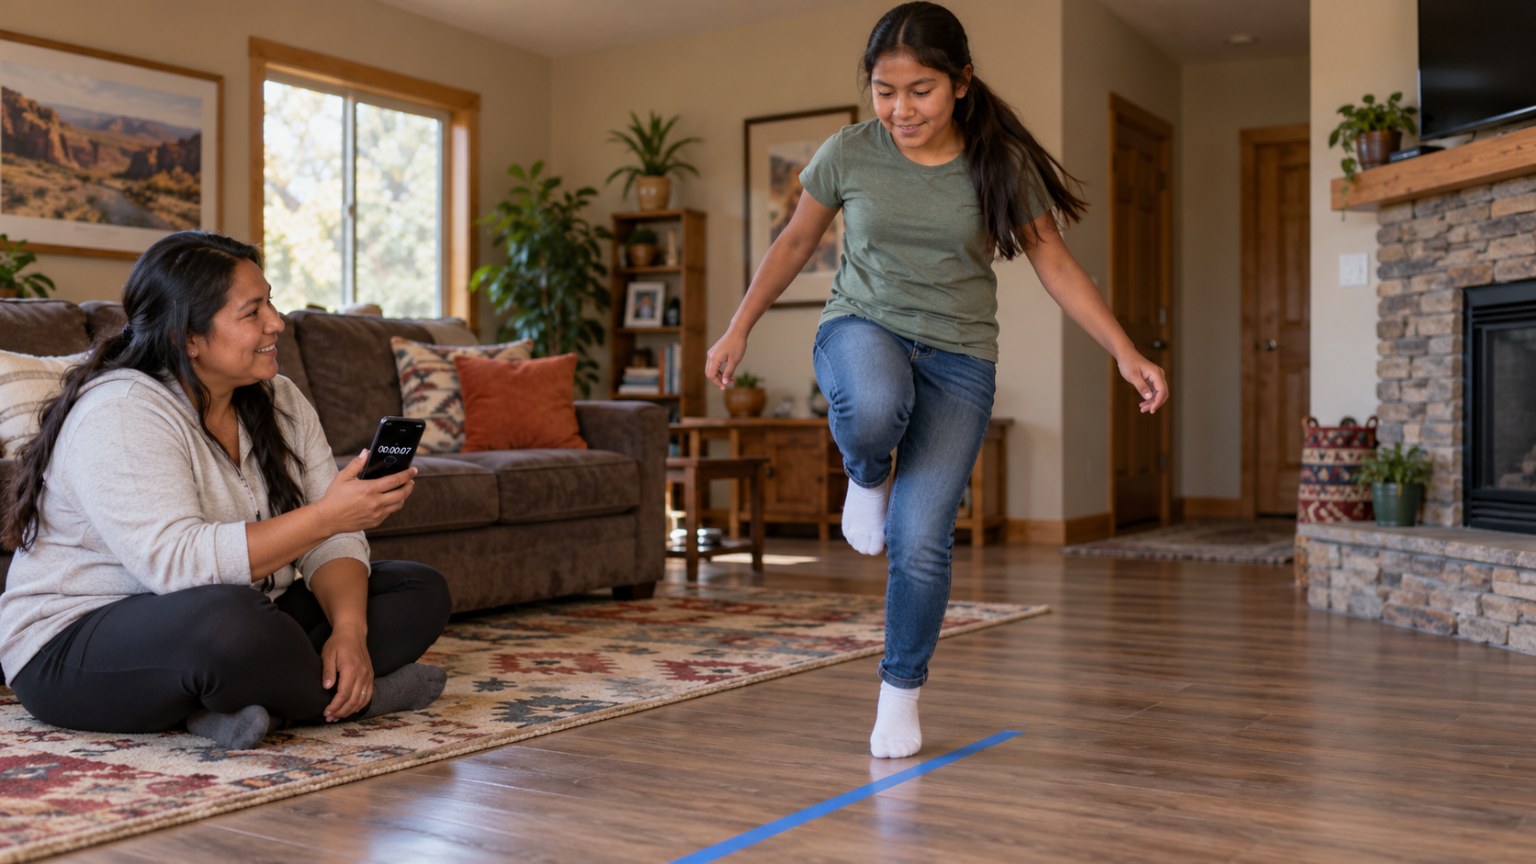
Tape-Line Hop Test: Two Feet vs. One Foot
Count timed line hops and compare two data sets with MAD.
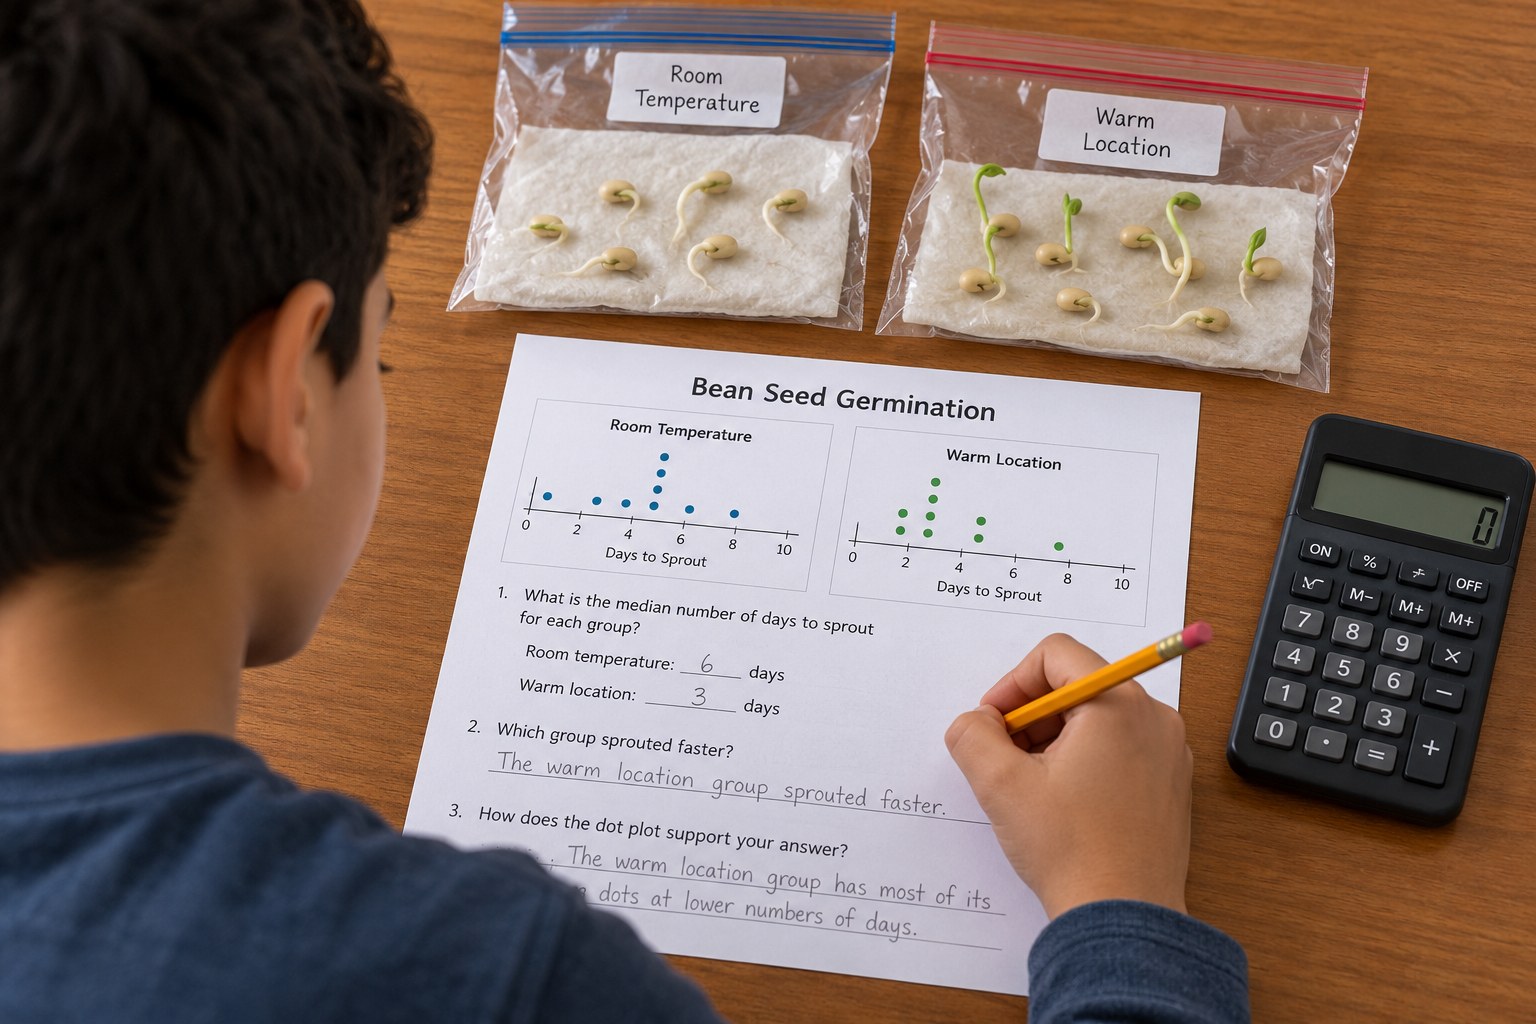
Gardening Seed Soak Experiment: Does Soaking Speed Germination? Mean and MAD
Test whether soaking seeds makes them sprout faster, with real stats.
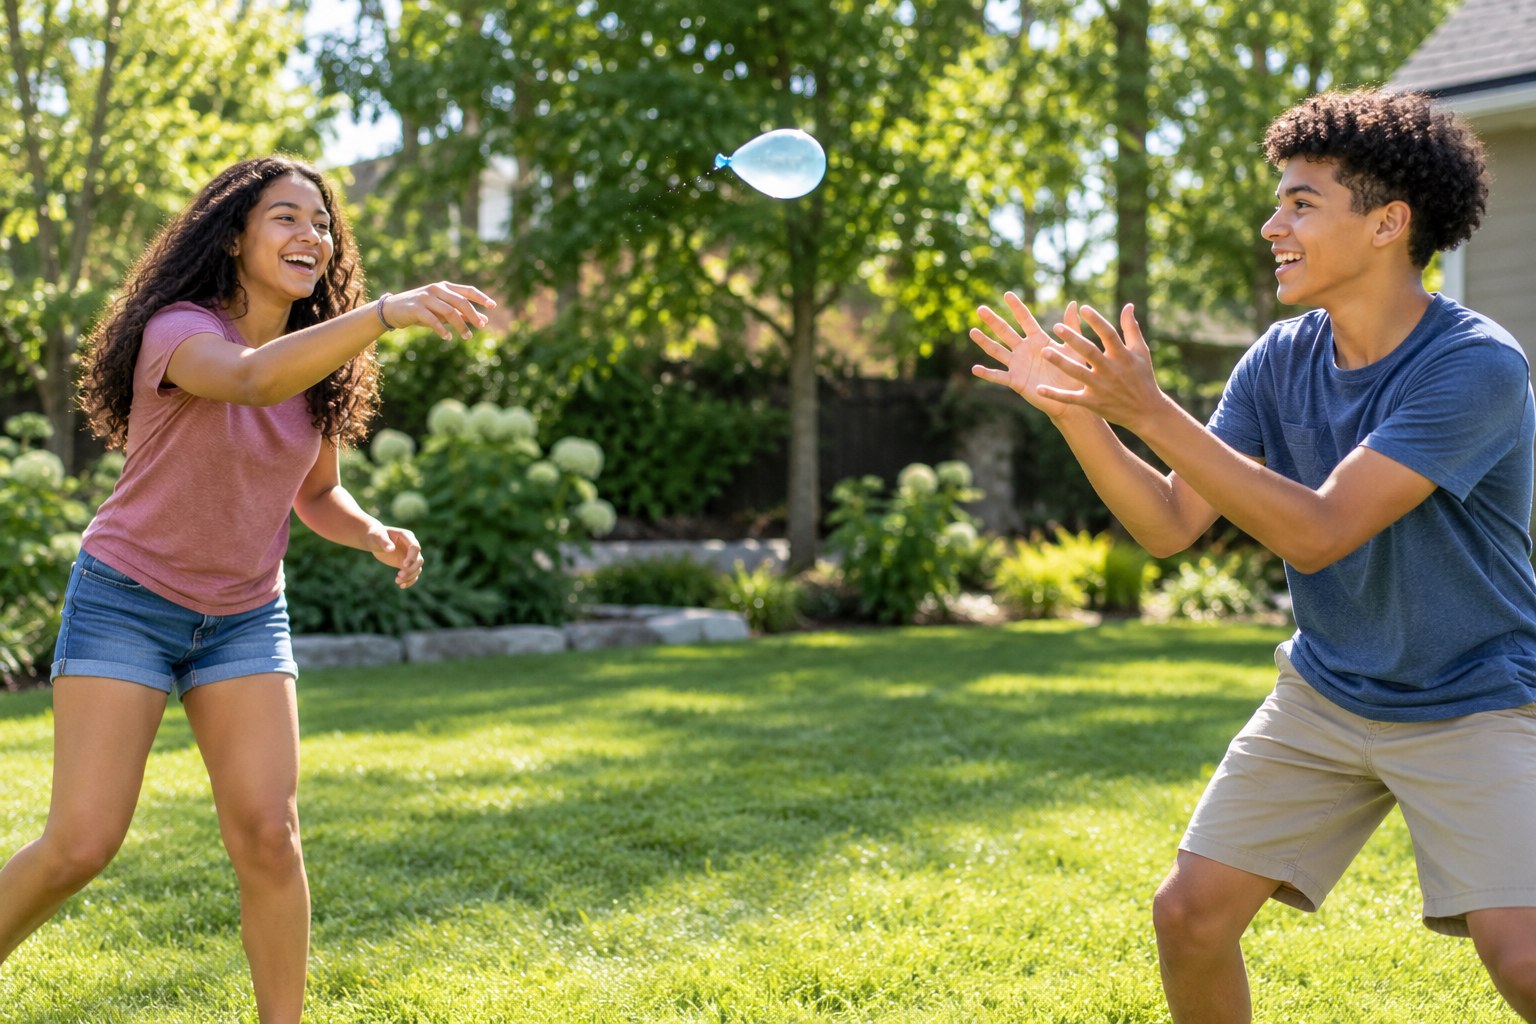
Summer Water Balloon Toss: Soft Hands vs. Stiff Hands Data
Toss water balloons and use data to prove soft hands work.
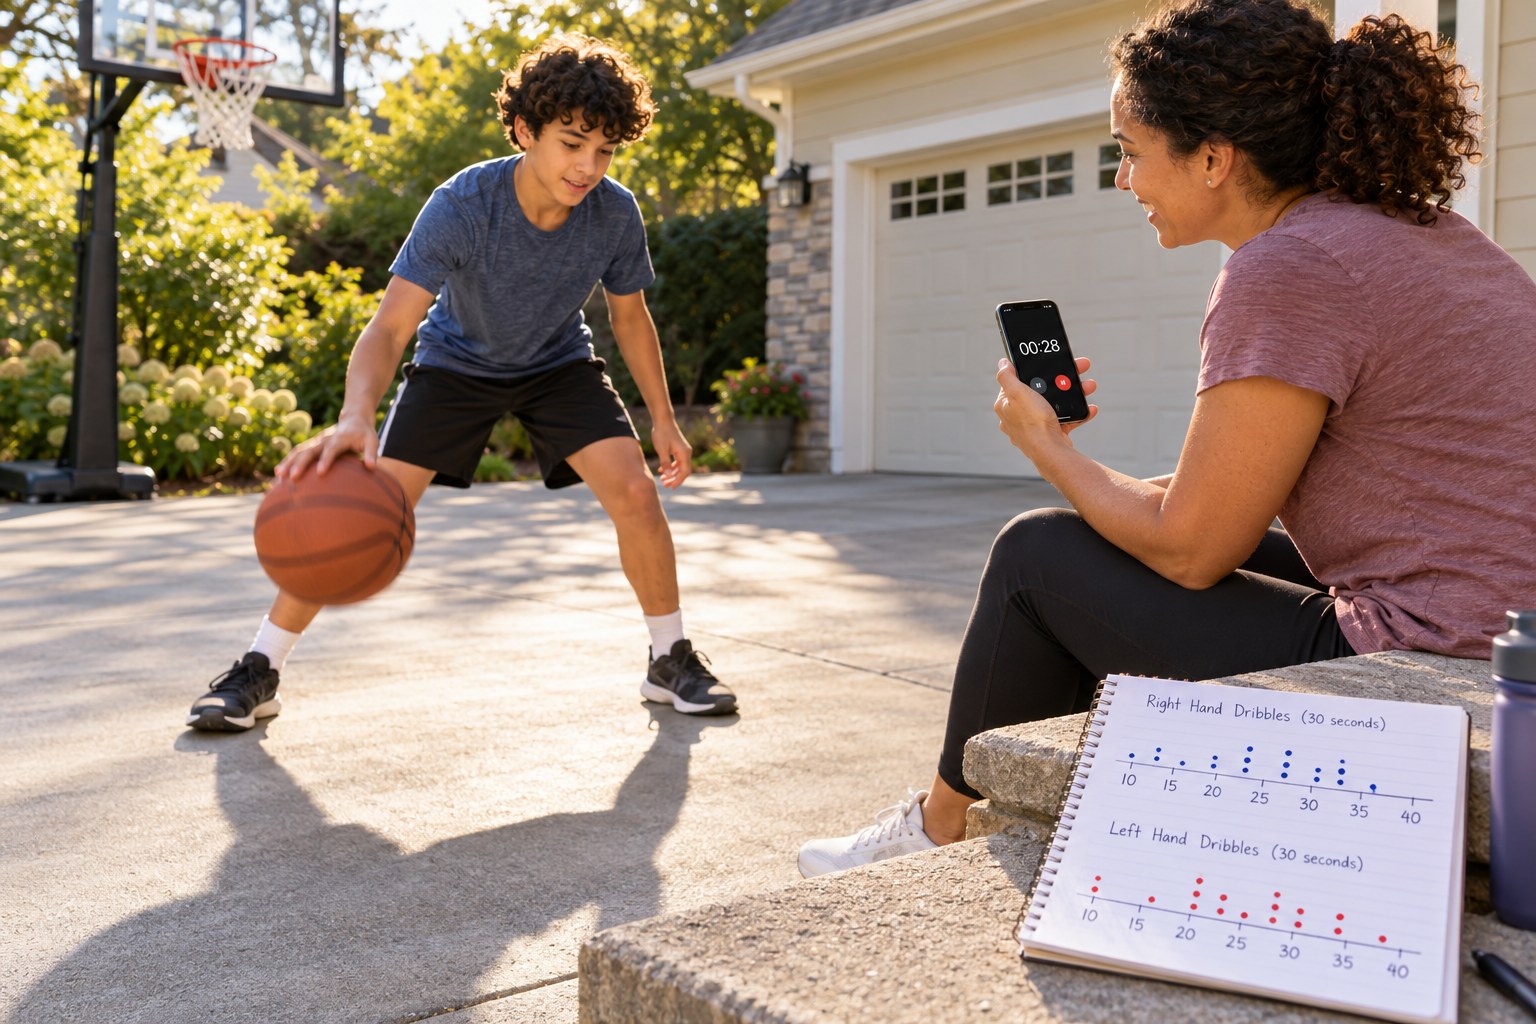
Weak Hand Workout: Dribble Counts and Comparing Two Distributions
Compare strong-hand and weak-hand dribble data with dot plots.
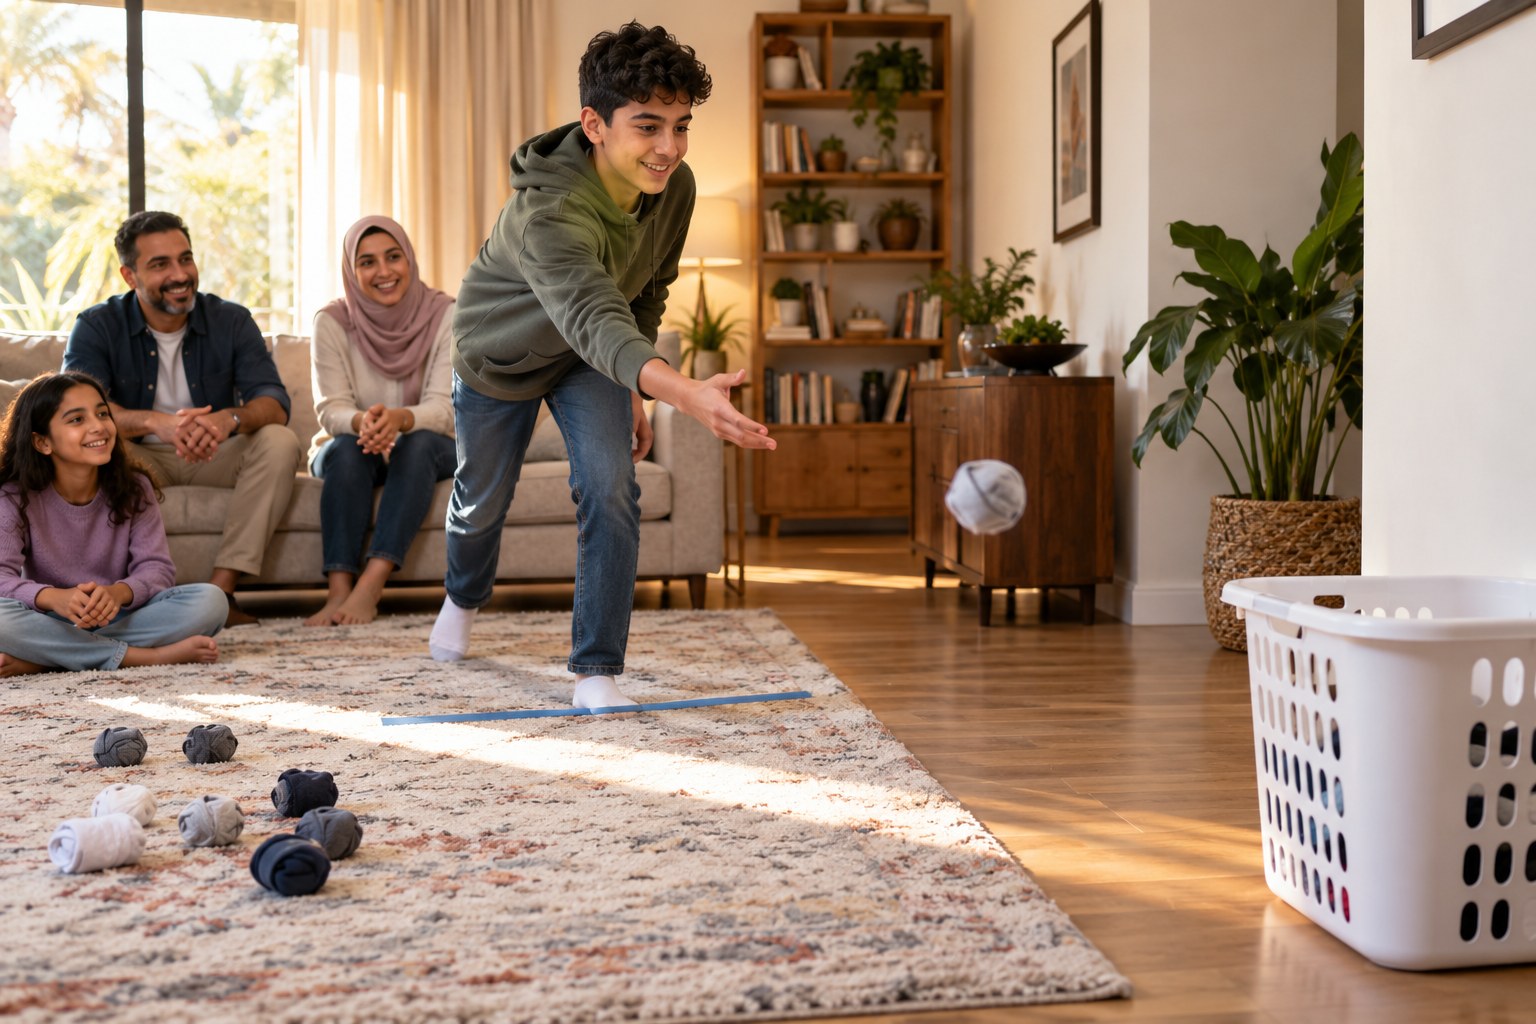
Sock-Ball Free Throws: Comparing Two Shooting Styles with Data
Shoot sock-ball free throws and compare styles with stats.
See all grade 7 standards with lesson plans
Make a lesson like this in a minute
Pick a topic, grade, group size and length. Resource Portal AI writes the objectives, materials, steps and pictures.
Sign up FREEFree forever · no credit card needed. Members get all 5,100+ lessons for $14.99/month, with the first 7 days free.