
Lesson plans for 6.SP.3
Math · Grade 6 · Statistics & Probability
Recognize that a measure of center for a numerical data set summarizes all of its values with a single number, while a measure of variation describes how its values vary with a single number.
6 ready-to-teach lesson plans aligned to this standard. Each includes objectives, a materials list, vocabulary and step-by-step activities.
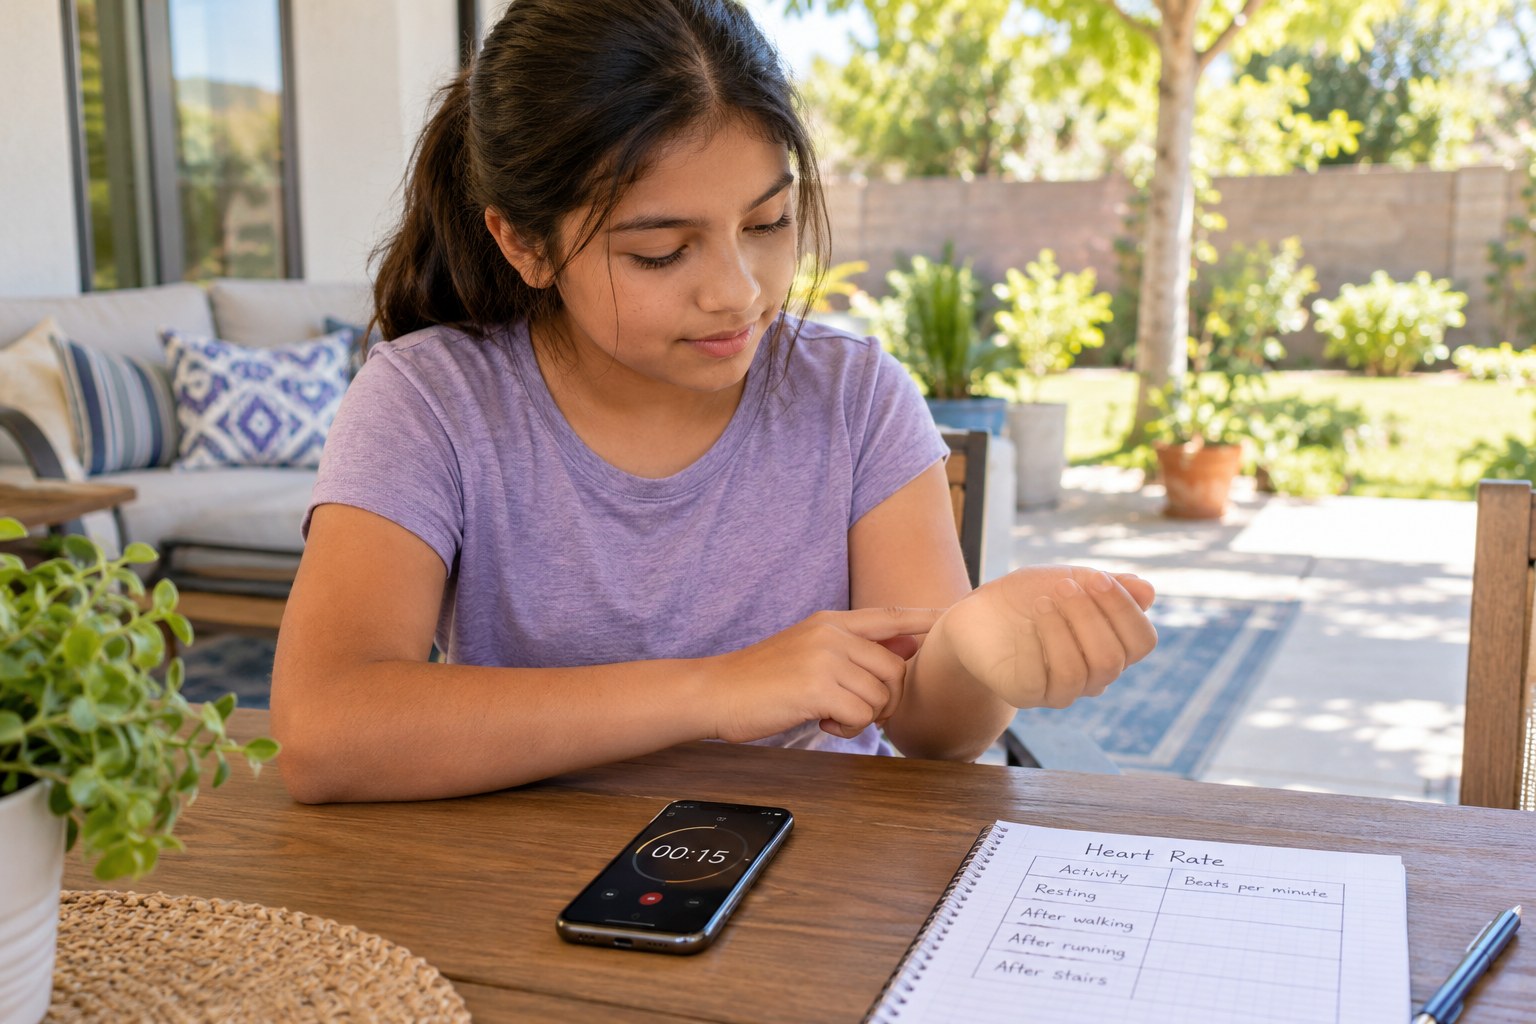
Pulse Check Math: From a 15-Second Count to Beats per Minute
Count your pulse and turn it into beats per minute.
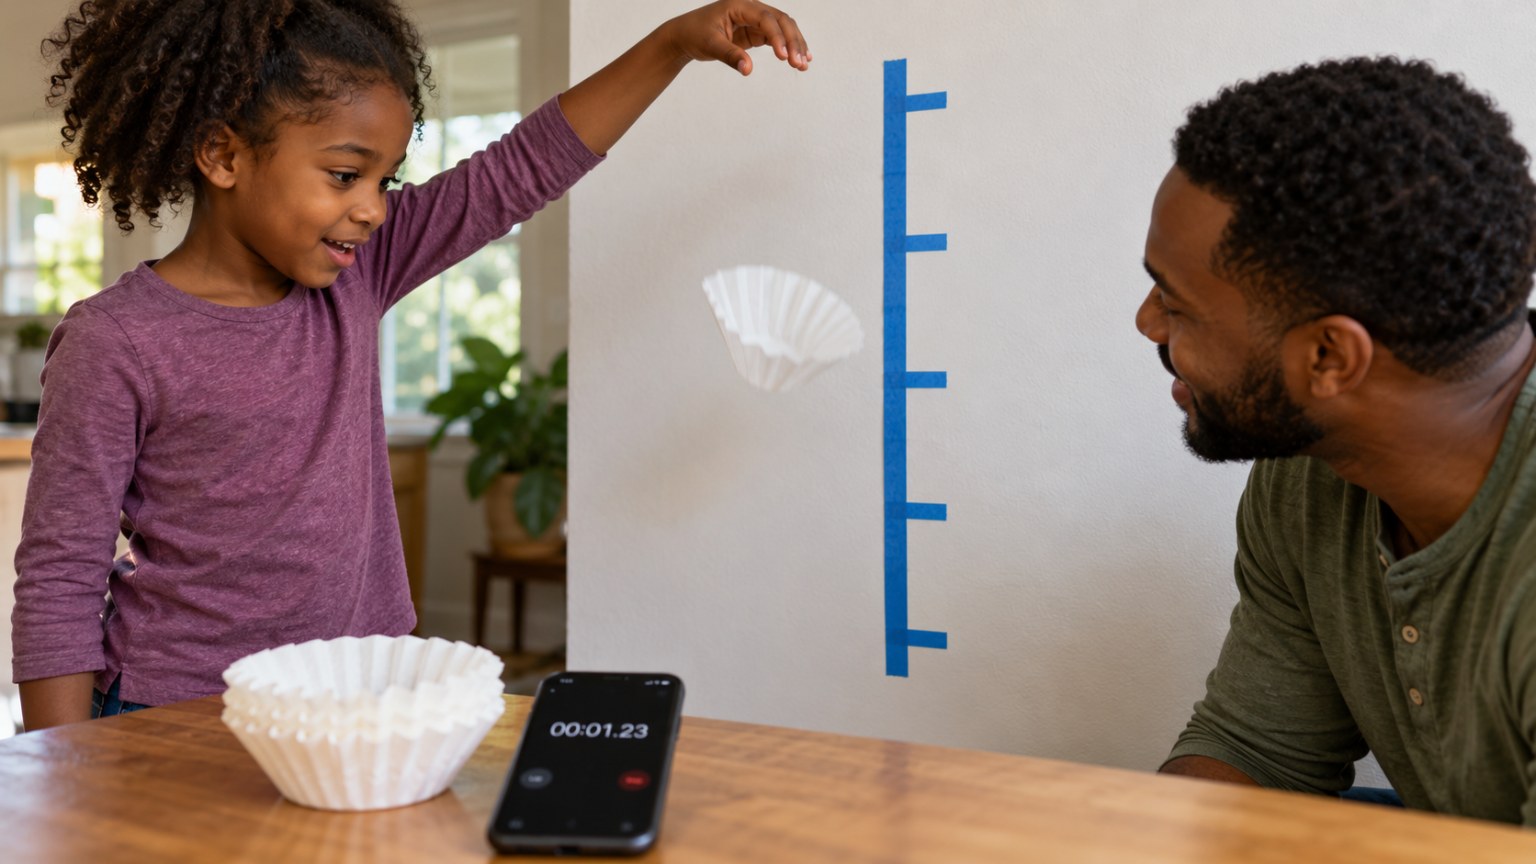
Falling Coffee Filters: Air Resistance and the Spread of Drop Times
Time falling coffee filters and choose the best average.
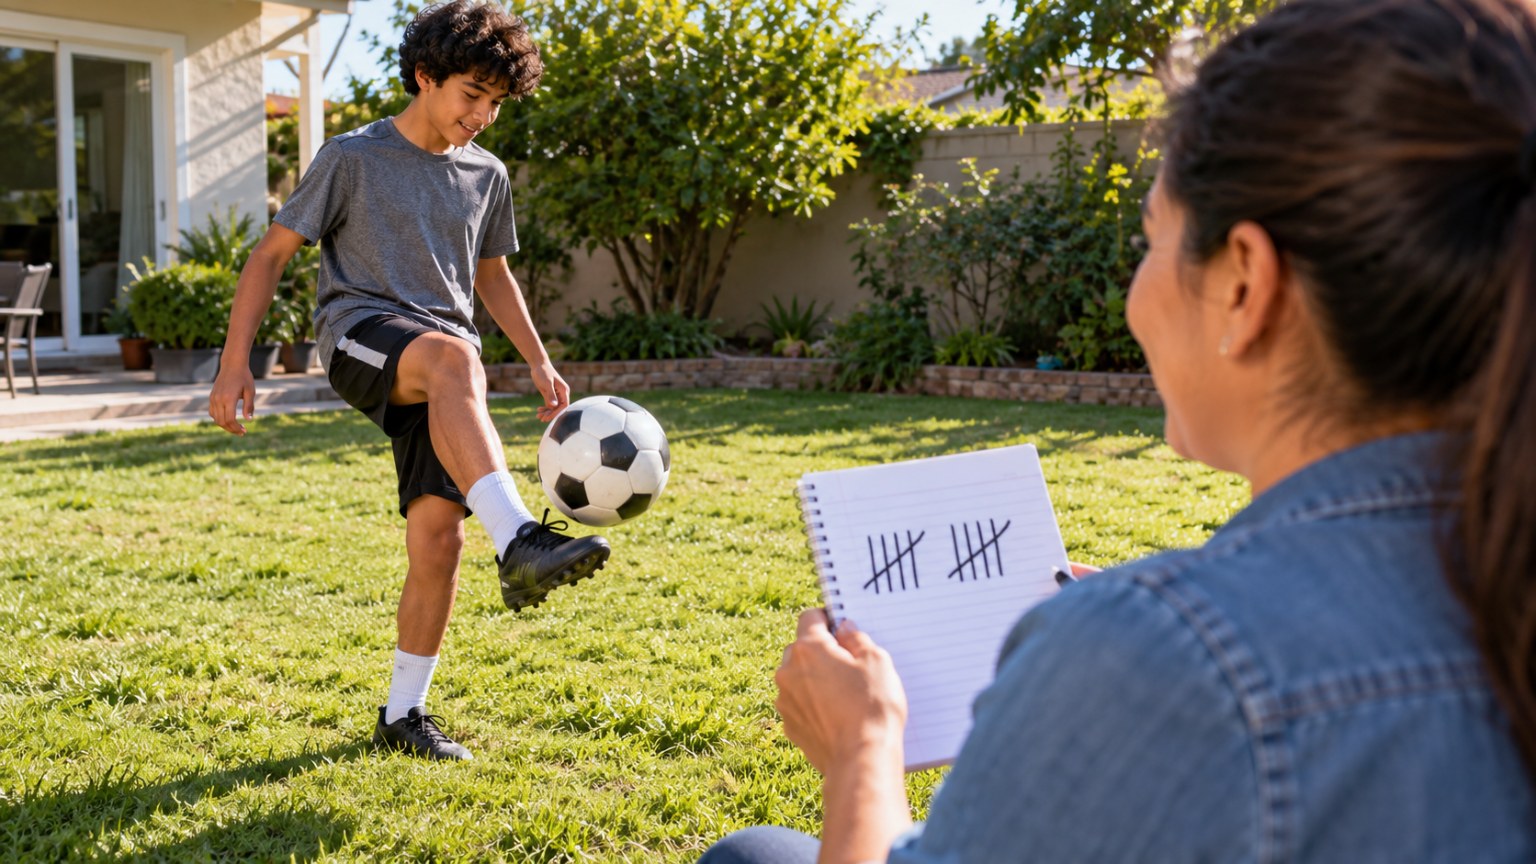
Keepy-Uppy Streaks: How Many Touches Before the Ball Drops?
Juggle a soccer ball and summarize your streaks with stats.
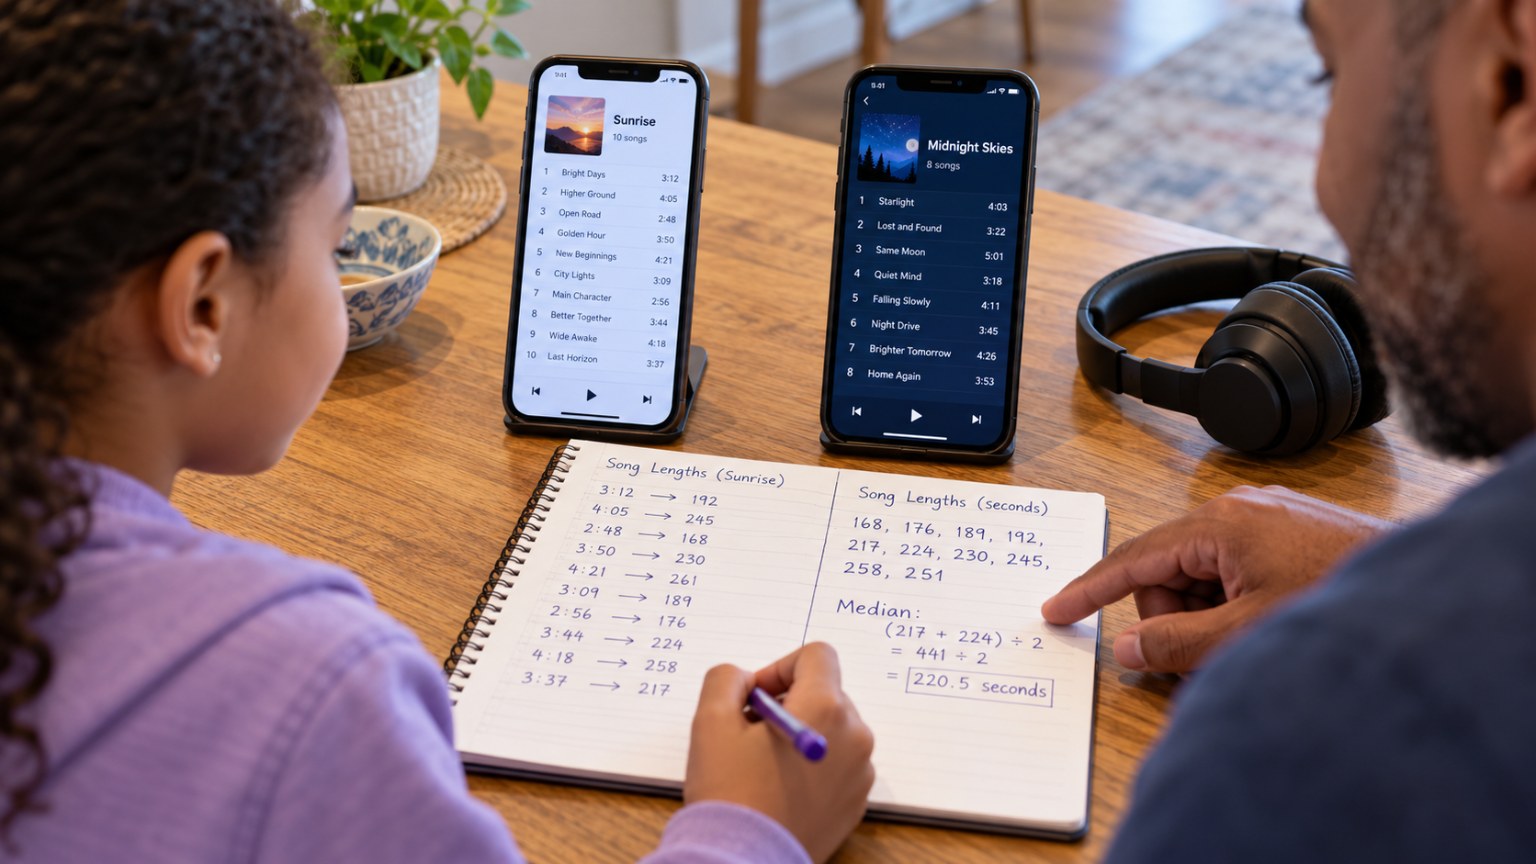
Then vs. Now: Are Songs Getting Shorter? Album Track Length Stats
Compare old and new album track lengths with statistics.
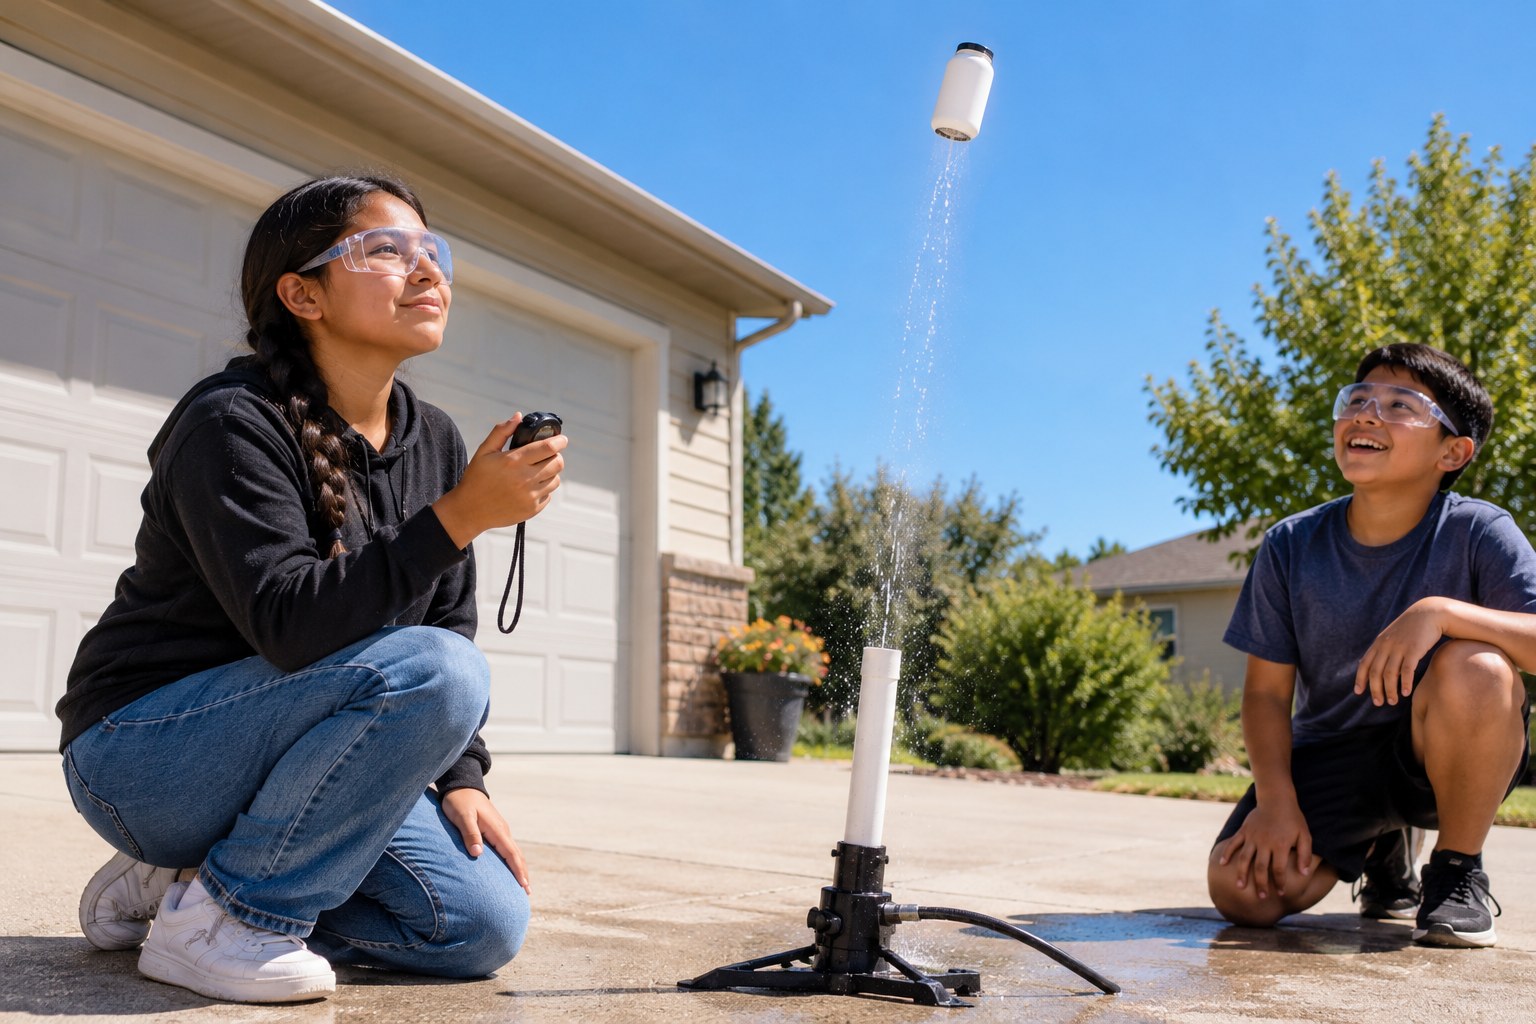
New Year's Countdown Popper Rockets: Timing Gas Pressure
Time fizzing popper rockets and use data to launch on the countdown.
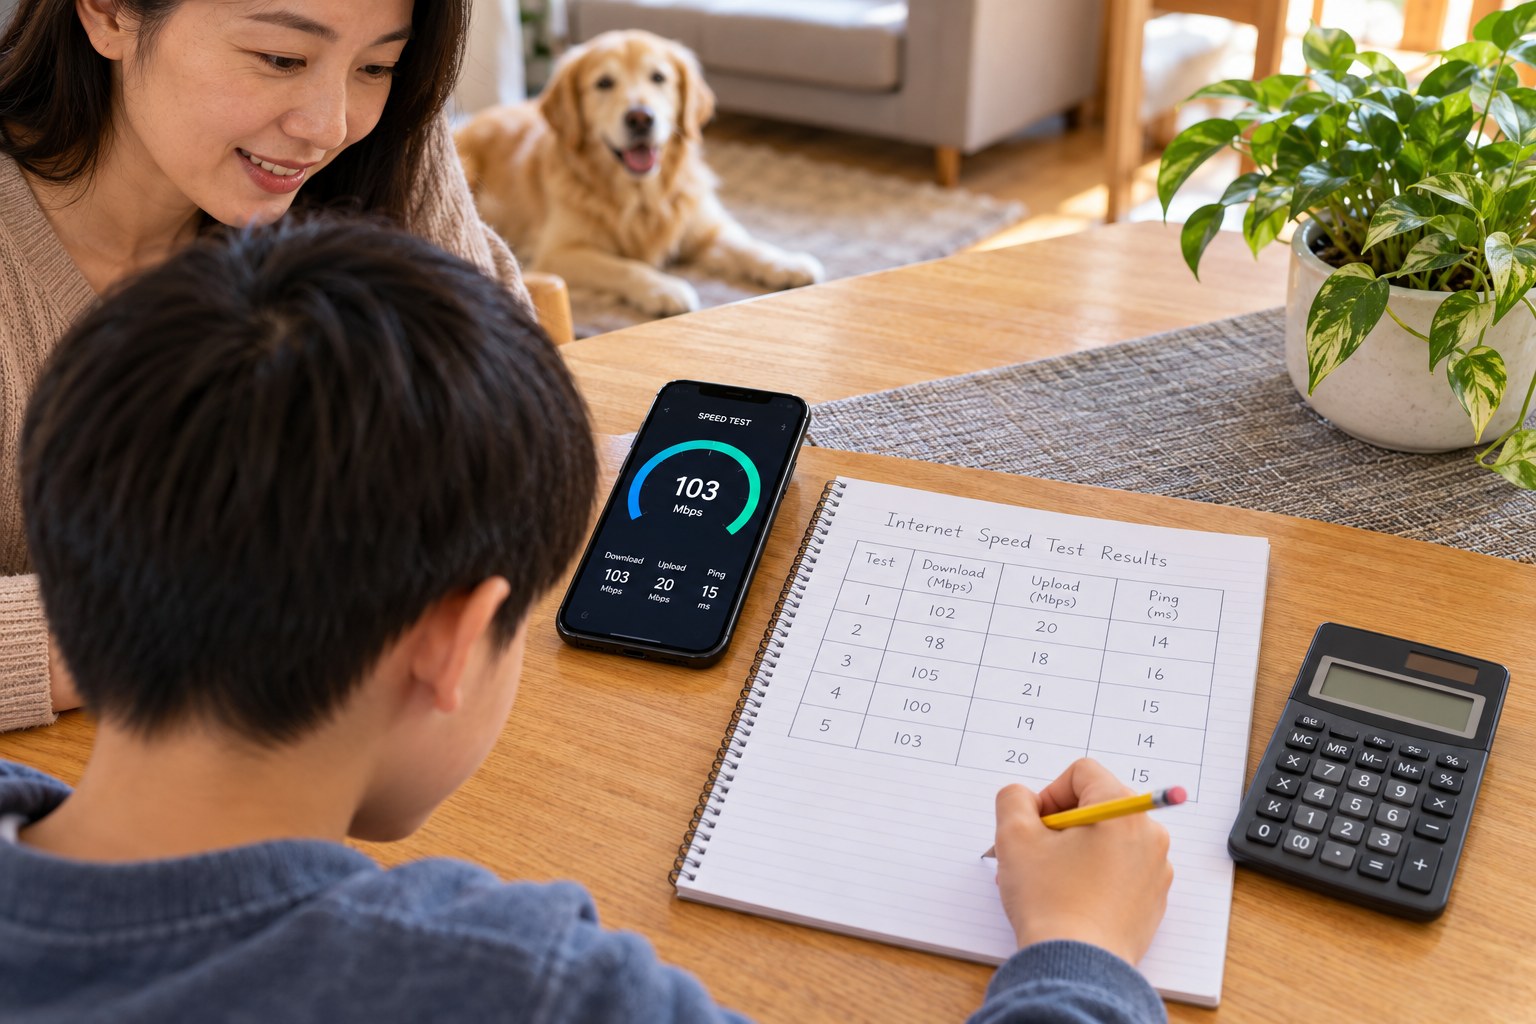
Wi-Fi Speed Map: Mean, Median and the Spread of Your Home Internet
Speed-test every room, then summarize the data with statistics.
See all grade 6 standards with lesson plans
Make a lesson like this in a minute
Pick a topic, grade, group size and length. Resource Portal AI writes the objectives, materials, steps and pictures.
Sign up FREEFree forever · no credit card needed. Members get all 5,100+ lessons for $14.99/month, with the first 7 days free.