Backyard Heat Island Hunt: Measuring Surface Temps Around Your Home
Overview
Measure how hot your driveway gets, then plot the proof.
Description
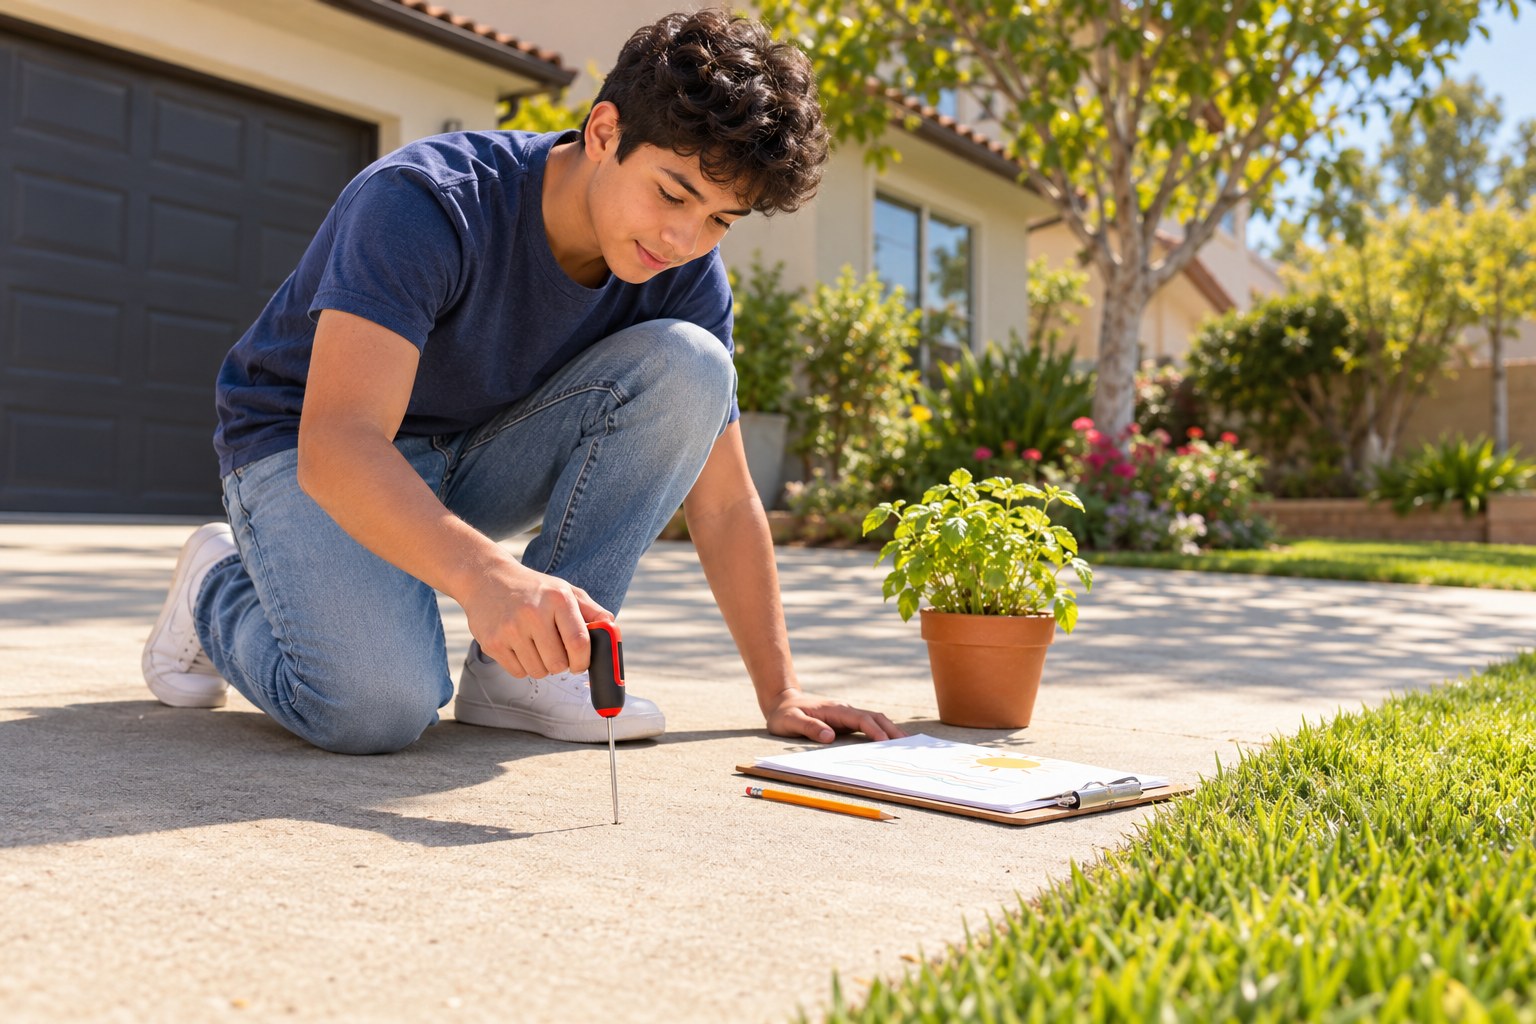
Your teen takes timed readings with a kitchen or outdoor thermometer on six surfaces (asphalt, concrete, grass, bare soil, a shaded spot and a light-colored surface) at midday, three times each, then plots all the readings on a dot plot. They connect the clusters to albedo and the urban heat island effect, practice with a sample data set and answer key, and propose two cooling fixes for their own block.
Objective
Your teen will collect surface temperature data and represent it with a dot plot to compare how different surfaces heat up, connecting the results to albedo and urban heat islands.
Standards
Materials
| Item | Quantity |
|---|---|
| Kitchen probe thermometer or outdoor thermometer | 1 |
| Timer or phone | 1 |
| Sheet of graph paper | 1 |
| Sheet of lined paper for a data table | 1 |
| Colored pencils | 6 |
| Pencil | 1 |
Vocabulary
Preparation
- Pick a sunny day and plan to measure between about noon and 1 pm.
- Find six spots near home: asphalt, concrete, grass, bare soil, a shaded spot and a light-colored surface such as a white board, painted curb or pale tile.
- Safety: hot pavement can burn skin; your teen wears shoes and does not touch surfaces with bare hands or feet.
Introduction
On a hot day, ask your teen to hover a hand (not touch) just above the driveway and then above the grass. Ask: if the air is the same temperature everywhere, why does the driveway feel like an oven?
Why do some neighborhoods feel hotter than others on the same day?
What color would you paint a roof in a hot place, and why?
Steps
Conclusion
Ask: if your whole street were the hottest surface you measured, how would it feel to walk to school in July? Small changes in surfaces add up across a whole city.
Make your own lesson plan in minutes
Describe a topic and Resource Portal AI writes the objectives, materials and steps for your group.
Try Resource Portal AI