Fall Weather Watch: A Week of Sky Pictures and a Weather Graph
Overview
Track a week of fall weather and graph it.
Description
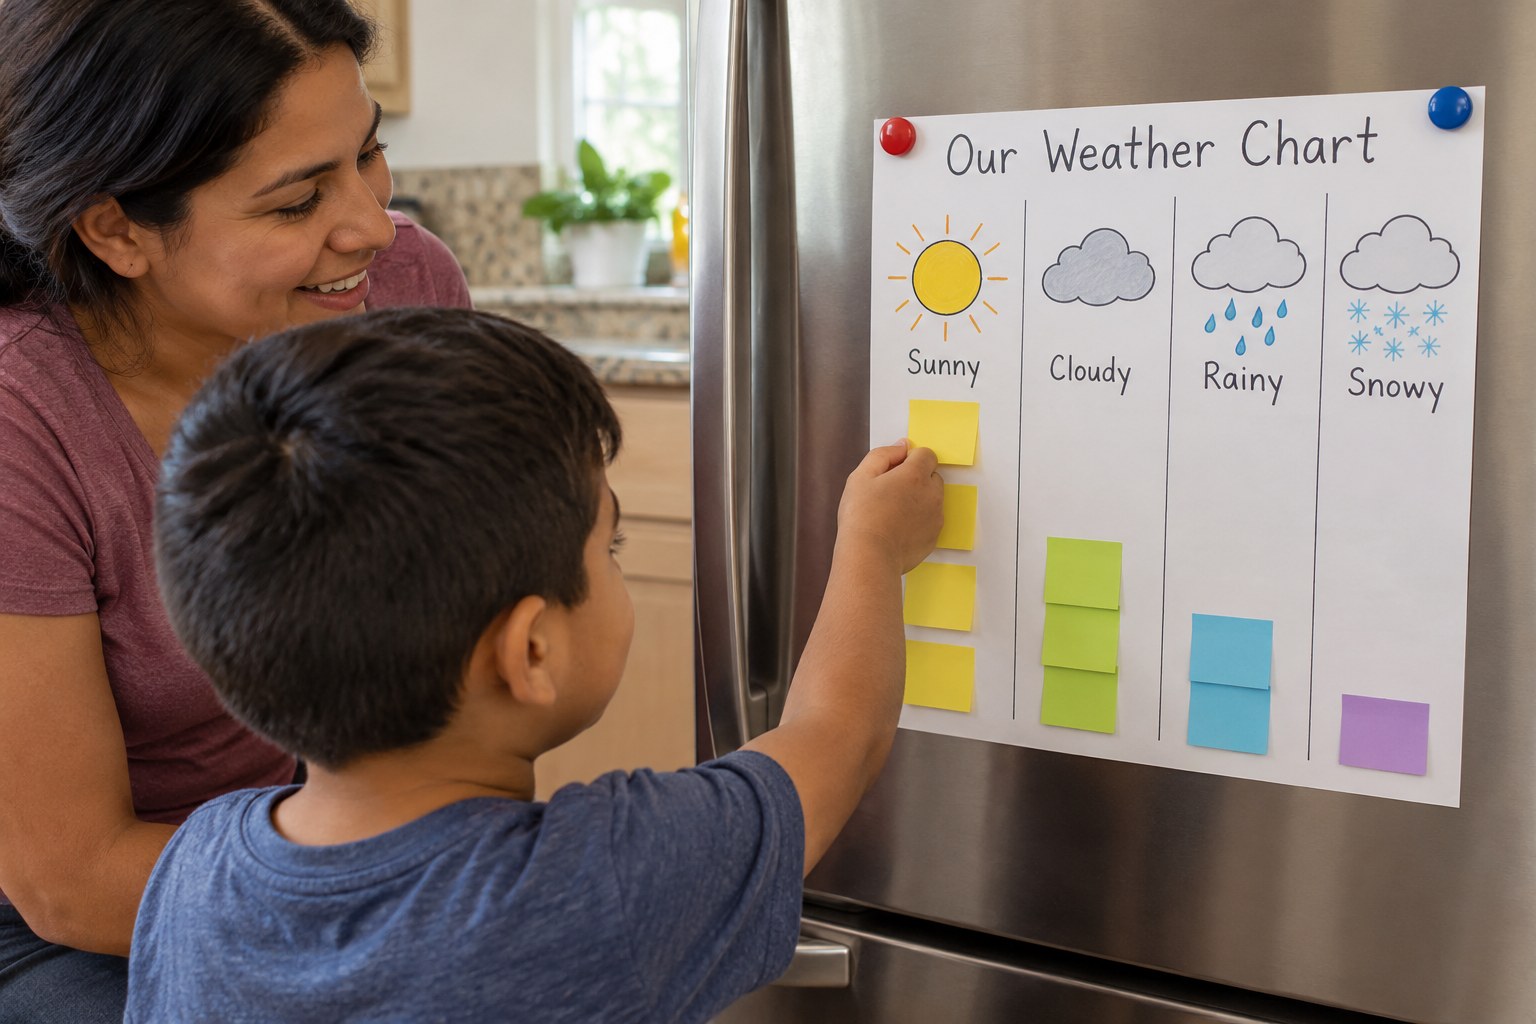
Your child becomes a fall weather watcher, checking the sky and the air each day for a week, recording sunny, cloudy, windy or rainy with simple pictures, then turning the week into a graph and answering how-many questions.
Objective
Your child will observe and record daily fall weather in categories, organize the data in a simple graph, and answer questions about how many days were in each category and how many more or fewer.
Standards
Materials
| Item | Quantity |
|---|---|
| Sheet of paper or poster board for a weather chart | 1 |
| Crayons or markers | 1 set |
| Outdoor thermometer (optional) | 1 |
| Sticky notes or paper squares | about 10 |
| Ribbon or a strip of fabric tied to a fence, porch rail or stick to show wind | 1 |
Vocabulary
Preparation
- Draw a chart with 7 boxes, one for each day of the week, with room for a weather picture in each box.
- Tie a ribbon somewhere you can see from a window so your child can check for wind.
Introduction
Ask your child to step outside and close their eyes for 10 seconds. What do they feel on their skin, and what do they hear? Fall weather can change a lot from day to day. This week, you are the family weather reporter.
What is the weather like in fall where we live?
How can we tell if it is windy without feeling it?
Steps
Conclusion
Ask: what kind of weather happened most this week? Make a forecast for tomorrow and check if you were right.
Make your own lesson plan in minutes
Describe a topic and Resource Portal AI writes the objectives, materials and steps for your group.
Try Resource Portal AI