Lesson planRainforest Food Web Yarn Network
STEAM40 minutesGrades: 6th, 7th
Overview
Build a yarn food web and measure what breaks when a species disappears.
Description
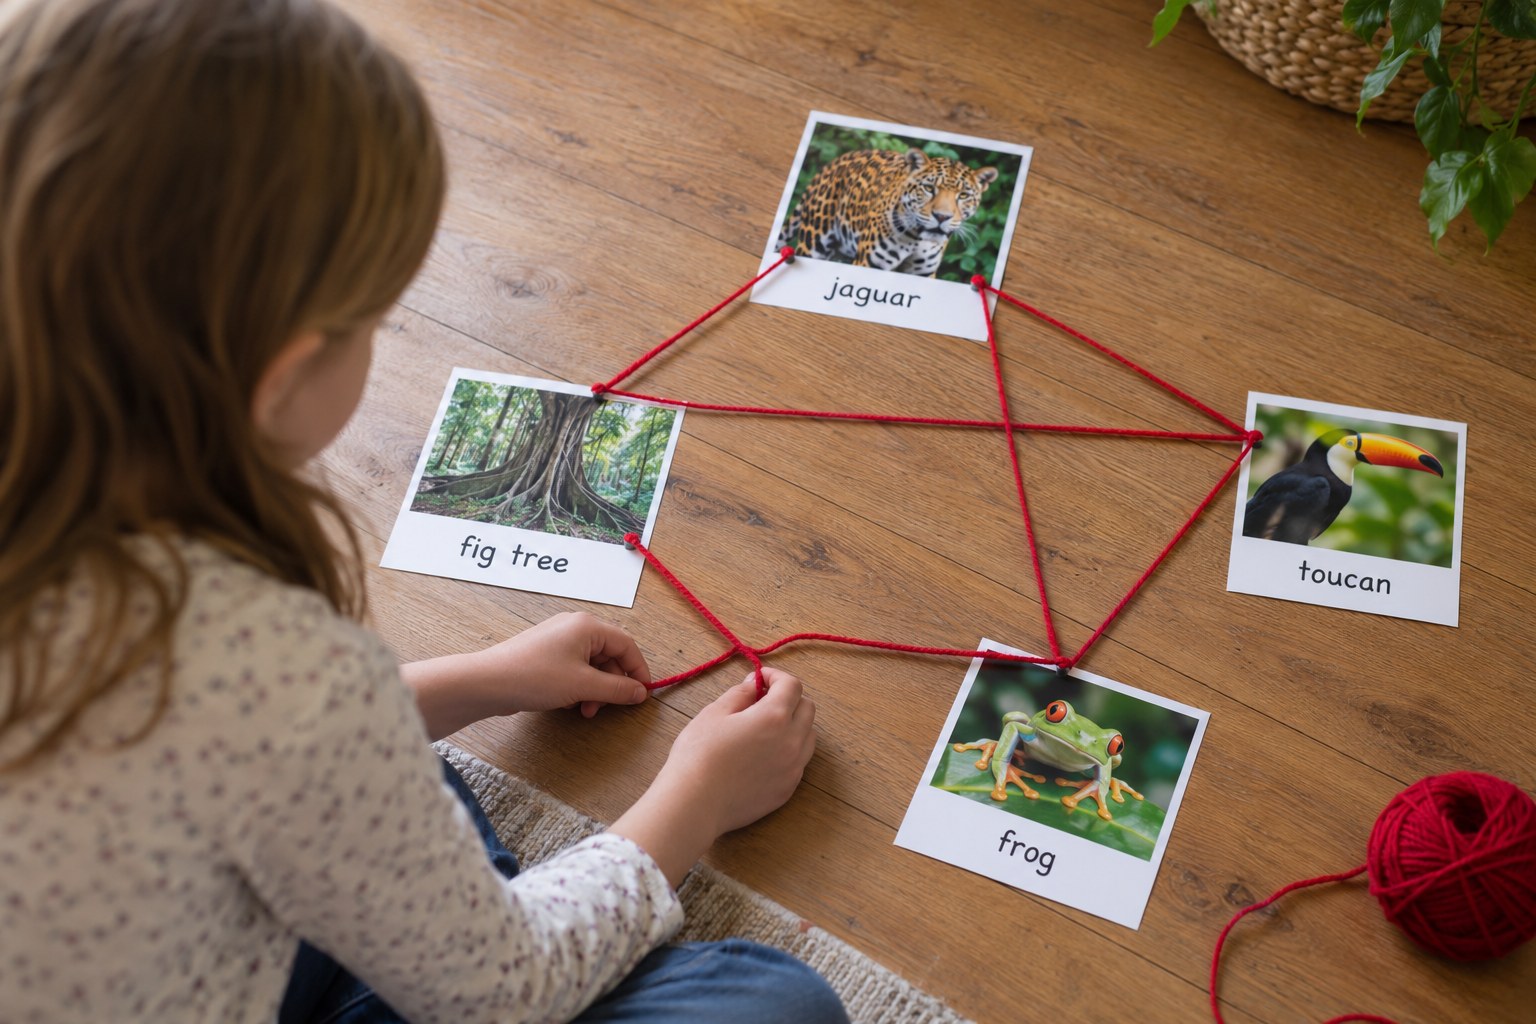
Your teen builds a physical Amazon rainforest food web with yarn connecting species cards, counts the feeding links, then removes one species to model an extinction and uses ratios and percents to measure how much of the web collapses.
Objective
Your teen will model a rainforest food web, describe producer-to-consumer relationships with ratio language, and calculate the percent of feeding links lost when a species is removed.
Standards
6.RP.1Math · Grade 6 · Ratios & Proportional Relationships Understand the concept of a ratio and use ratio language to describe a ratio relationship between two quantities.
6.RP.3cMath · Grade 6 · Ratios & Proportional Relationships Find a percent of a quantity as a rate per 100 (e.g., 30% of a quantity means 30/100 times the quantity); solve problems involving finding the whole, given a part and the percent.
Materials
| Item | Quantity |
|---|
| Index cards for species | 12 |
| Ball of yarn or string | 1 |
| Tape or binder clips | 12 |
| Marker | 1 |
| Calculator | 1 |
| Paper and pencil for data | 1 each |
| Floor or table space about 4 feet across | 1 |
Vocabulary
Food web
A network of overlapping food chains showing who eats whom in an ecosystem.
Producer
An organism, usually a plant, that makes its own food from sunlight.
Keystone species
A species that many others depend on, so losing it changes the whole ecosystem.
Decomposer
An organism, like a fungus, that breaks down dead material and returns nutrients to the soil.
Ratio
A comparison of two quantities, such as 4 producers to 8 consumers.
Preparation
- Write one species per card: Brazil nut tree, fig tree, legume vine (pea family), leafcutter ant, fungi (decomposers), blue morpho butterfly, agouti, howler monkey, toucan, red-eyed tree frog, boa constrictor, jaguar.
- Arrange the cards in a large circle on the floor or table with producers on one side. For a group, each person holds 1 or 2 cards and the yarn passes between people.
Introduction
Hand your teen the jaguar card and ask: if all the fig trees disappeared, would the jaguar care? Most people say no. By the end of this activity, you will be able to prove whether it would, with numbers.
How could losing a plant affect a predator that never eats plants?
What makes one species more important to an ecosystem than another?
Steps
1Step 1
Map the links
(10 min) Using the 'Food web links' list, your teen connects each pair of cards with a piece of yarn, taping the ends down, and draws an arrow on paper from the food to the eater. Count the total links (the list has 20).
2Step 2
Describe the web with ratios
(7 min) Your teen counts producers, consumers and decomposers and writes ratio statements such as '3 producers to 8 consumers' and 'for every producer, there are about 2.7 consumers'. Ask: what does that ratio tell you about how much the consumers depend on the plants?
3Step 3
Remove a species
(8 min) Your teen removes the fig tree card and every piece of yarn attached to it. Count the links lost and calculate the percent: links lost divided by 20, times 100. Then check which animals lost a food source.
4Step 4
Test a keystone
(8 min) Rebuild the web, then remove a different species, such as the agouti or the leafcutter ant, and calculate the percent of links lost again. Rank the species from most to least connected.
5Step 5
Explain the evidence
(7 min) Your teen writes a short claim: 'The ___ is the most important species in this web because removing it cut __% of the links.' Discuss what the yarn model leaves out, like how many individuals of each species there are. Then decide whether link count alone is enough evidence.
Conclusion
Ask: would the jaguar care if the fig trees disappeared? How do your percents prove it? Scientists call figs a keystone resource in many tropical forests because they fruit year-round and feed many animals.
Make your own lesson plan in minutes
Describe a topic and Resource Portal AI writes the objectives, materials and steps for your group.
Try Resource Portal AI