Lesson planChristmas Tree Farm Math: Growth Equations and Planting Grids
Math40 minutesGrades: 6th, 7th
Overview
Model tree growth and plan a Christmas tree farm with equations.
Description
Your teen models how a Christmas tree grows on a farm with a table, graph and equation, solves for the year a tree reaches selling height, and uses one-step equations to figure out how many trees fit on an acre.
Objective
Your teen will write an equation relating tree height to years after planting, show the relationship in a table and graph, and solve one-step equations about harvest time and planting density.
Standards
6.EE.7Math · Grade 6 · Expressions & Equations Solve real-world and mathematical problems by writing and solving equations of the form x + p = q and px = q for cases in which p, q and x are all nonnegative rational numbers.
6.EE.9Math · Grade 6 · Expressions & Equations Use variables to represent two quantities in a real-world problem that change in relationship to one another; write an equation to express one quantity, thought of as the dependent variable, in terms of the other quantity, thought of as the independent variable. Analyze the relationship between the dependent and independent variables using graphs and tables, and relate these to the equation.
Materials
| Item | Quantity |
|---|
| Graph paper | 2 sheets |
| Pencil, ruler and calculator | 1 each |
| Tree farm data card (from the section below) | 1 copy |
| Optional: a real tree, pine cutting or photo of a tree farm | 1 |
Vocabulary
Independent variable
The quantity you change or that changes on its own, here years since planting.
Dependent variable
The quantity that depends on the other, here tree height.
Acre
A unit of land area equal to 43,560 square feet.
Rotation
The cycle of planting, growing and harvesting trees on a farm.
Preparation
- Copy the tree farm data card. Draw axes on graph paper: years (0 to 10) on the x-axis and height in feet (0 to 12) on the y-axis.
- If you have a real or cut tree at home, measure its height.
Introduction
Ask: how old do you think a 7-foot Christmas tree is when it is cut? Most people guess one or two years. The real answer surprises them.
What would you need to know to predict when a tree is ready to sell?
Why can't a farmer plant trees right next to each other?
Steps
1Step 1
Read the data
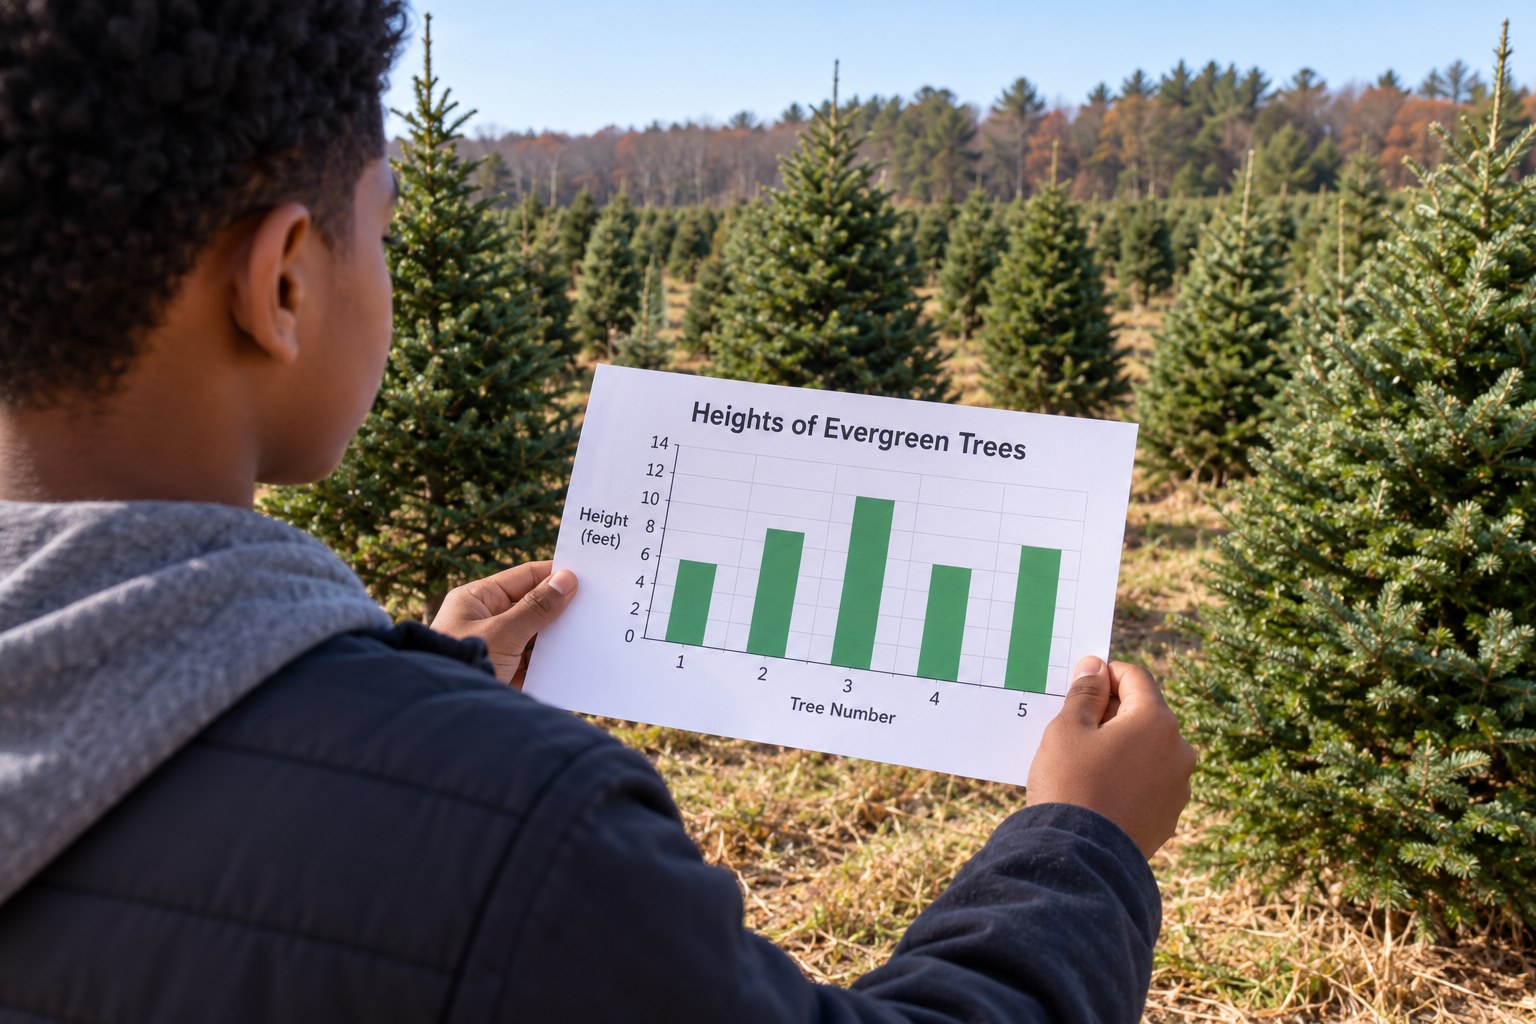
(5 min) Your teen reads the data card and the 'About Christmas' section. They identify the independent variable (years) and the dependent variable (height).
2Step 2
Table and equation
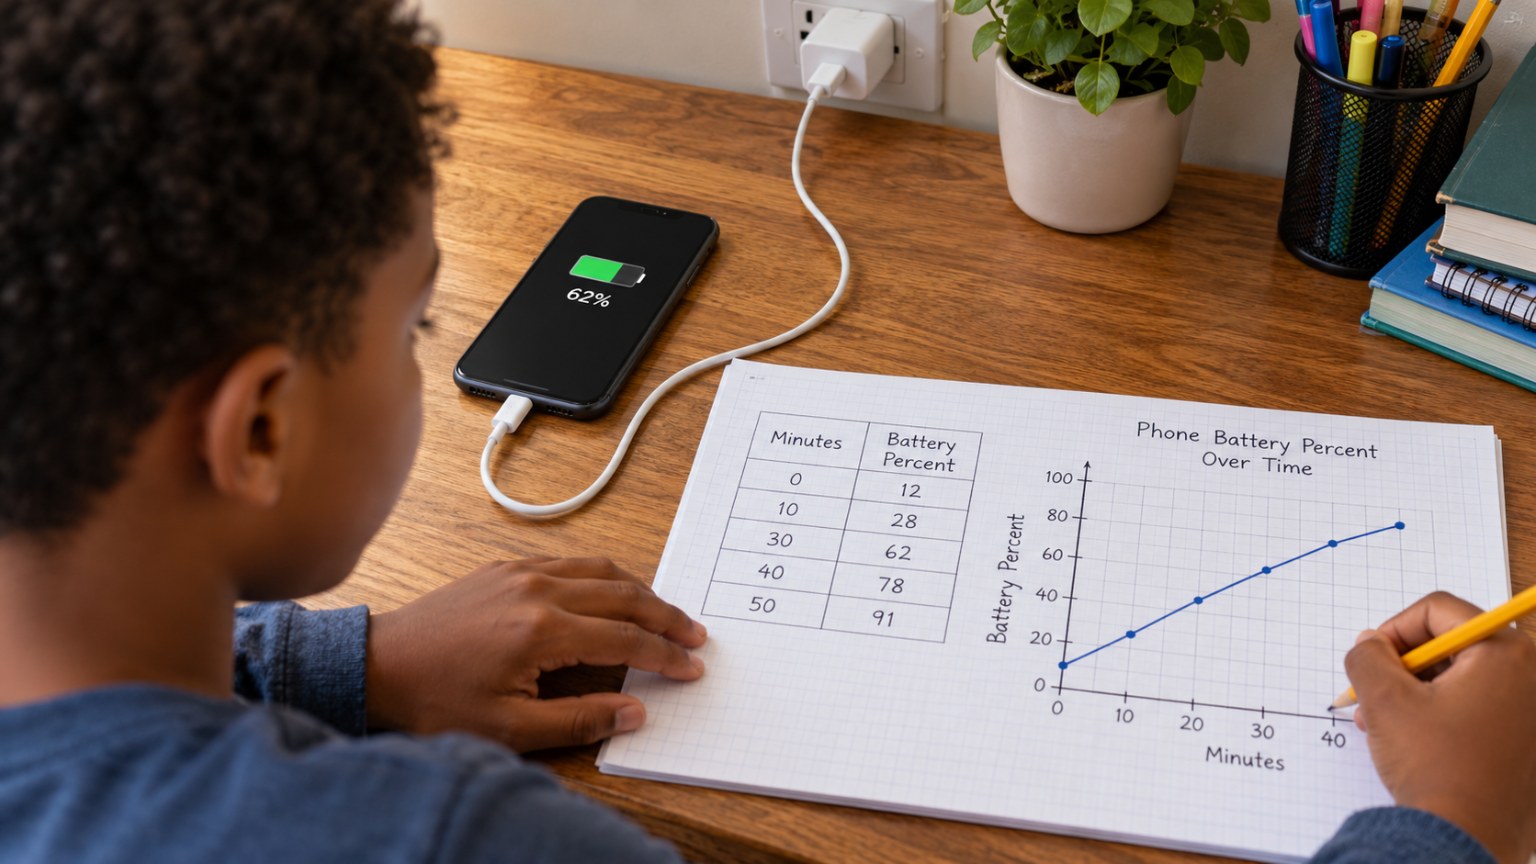
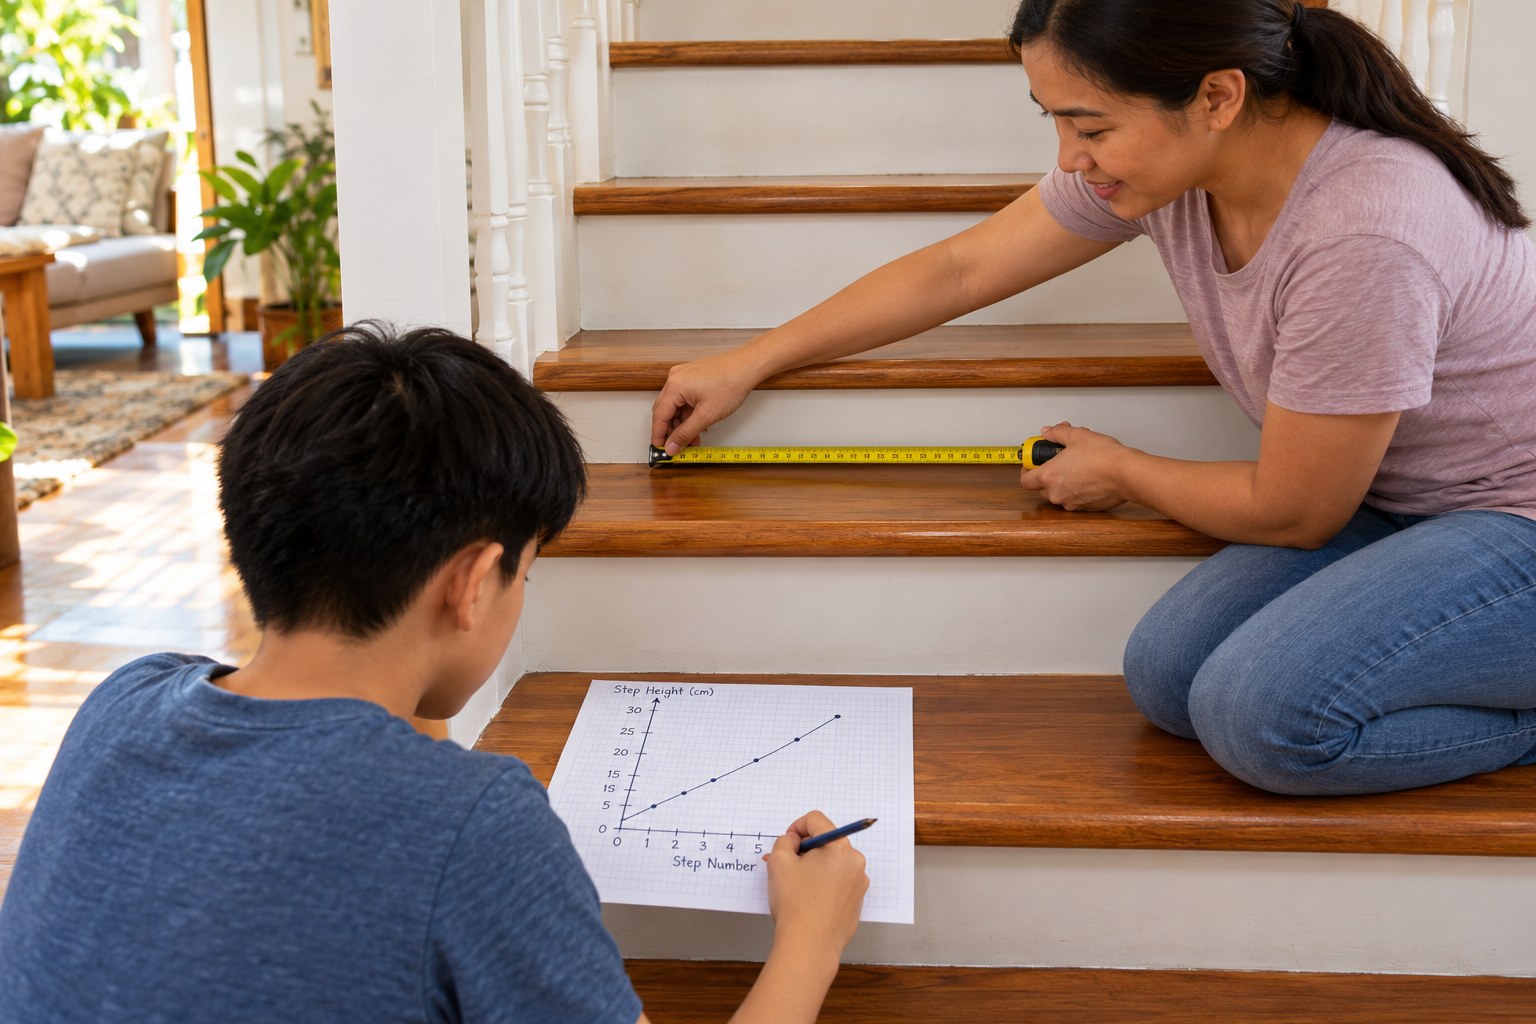
(10 min) Using the model in the data card, your teen fills in a table for years 0 to 8. They write the equation h = y + 1, where h is height in feet and y is years after planting, and explain what the 1 means.
3Step 3
Graph it
(8 min) Your teen plots the points and draws a line through them. They add a second line for Farm B's taller seedlings (h = y + 2) and describe how the two lines compare.
4Step 4
Solve for harvest
(7 min) Your teen writes and solves equations: 7 = y + 1 gives y = 6 years for Farm A, and 7 = y + 2 gives y = 5 for Farm B. They explain the trade-off of buying bigger seedlings.
5Step 5
Plant the acre
(8 min) Each tree needs a 5-foot by 5-foot square, or 25 square feet. Your teen writes 25x = 43,560 and solves to find about 1,742 trees per acre, then answers the practice questions.
Conclusion
Ask: what does the model leave out? (Weather, pests, trees that don't survive, different species.) Real trees grow slowly at first; a farmer plans years ahead for every December.
Make your own lesson plan in minutes
Describe a topic and Resource Portal AI writes the objectives, materials and steps for your group.
Try Resource Portal AI