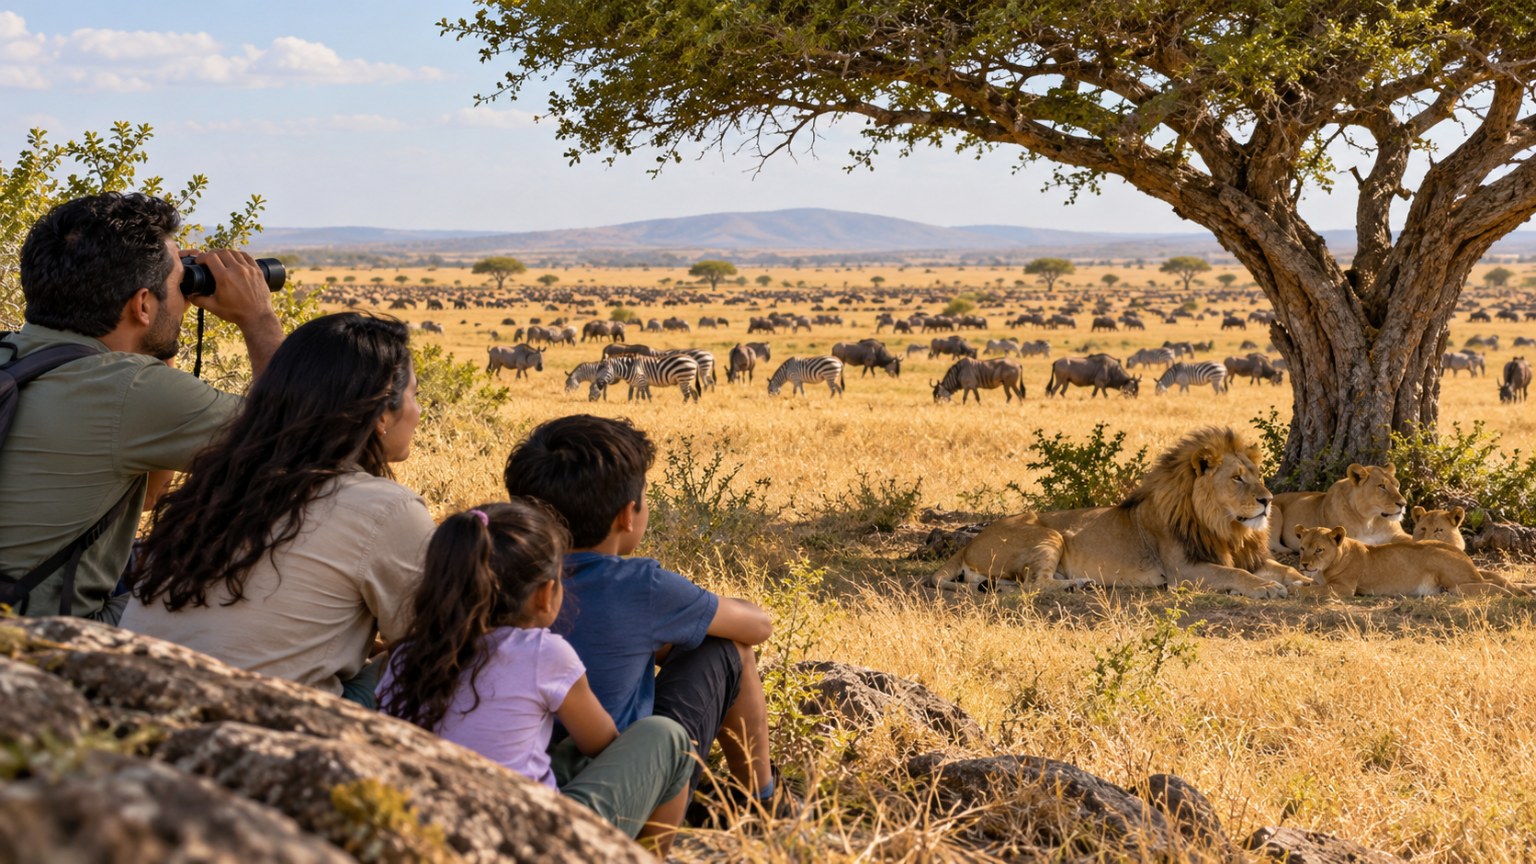
Lesson planSavanna Predator-Prey Ratios
Math45 minutesGrades: 6th, 7th
Overview
Use ratios to see why prey outnumber predators on the savanna.
Description
Your teen uses ratio language, ratio tables and unit rates to explore why savannas have far more grazers than predators, working with a practice wildlife census for a fictional reserve and connecting the math to real ecology.
Objective
Your teen will write ratios to describe predator and prey populations, complete ratio tables to scale populations up and down, find unit rates, and explain what the ratios show about energy in a food web.
Standards
6.RP.1Math · Grade 6 · Ratios & Proportional Relationships Understand the concept of a ratio and use ratio language to describe a ratio relationship between two quantities.
6.RP.3aMath · Grade 6 · Ratios & Proportional Relationships Make tables of equivalent ratios relating quantities with whole number measurements, find missing values in the tables, and plot the pairs of values on the coordinate plane. Use tables to compare ratios.
6.RP.3bMath · Grade 6 · Ratios & Proportional Relationships Solve unit rate problems including those involving unit pricing and constant speed.
Materials
| Item | Quantity |
|---|
| Practice census card and problems from this lesson, copied | 1 per teen |
| Graph paper or lined paper and pencil | 2 sheets |
| Calculator | 1 |
| Optional: dry beans or buttons in two colors to model populations (supervise around young siblings) | About 50 |
Vocabulary
Ratio
A comparison of two quantities, written as 3:1, 3 to 1 or 3/1.
Unit rate
A rate comparing a quantity to 1 unit of another, such as 25 zebras per lion.
Census
An official count of a population.
Trophic level
A feeding level in a food web, such as producers, herbivores or predators.
Preparation
- Copy the practice census card and problems from the additional sections.
- Read the 'Why the numbers look like this' section so you can discuss the ecology.
Introduction
Ask your teen to guess: on a savanna, for every lion, about how many large grazing animals do you think there are? 2? 10? 100? Write the guess down and revisit it at the end.
Why can't a savanna support as many lions as zebras?
How do scientists count animals across thousands of square miles?
Steps
1Step 1
Read the census
(6 min) Your teen reads the practice census card for the fictional Mto Reserve. Point out that real wildlife counts are done by rangers and scientists using aerial surveys, camera traps and ground counts.
2Step 2
Write ratios
(10 min) Your teen writes ratios from the census in three forms (a:b, a to b, a/b), including part-to-part and part-to-whole ratios. They write one sentence using ratio language, such as 'For every 1 lion there are 25 zebras' to describe the census.
3Step 3
Build ratio tables
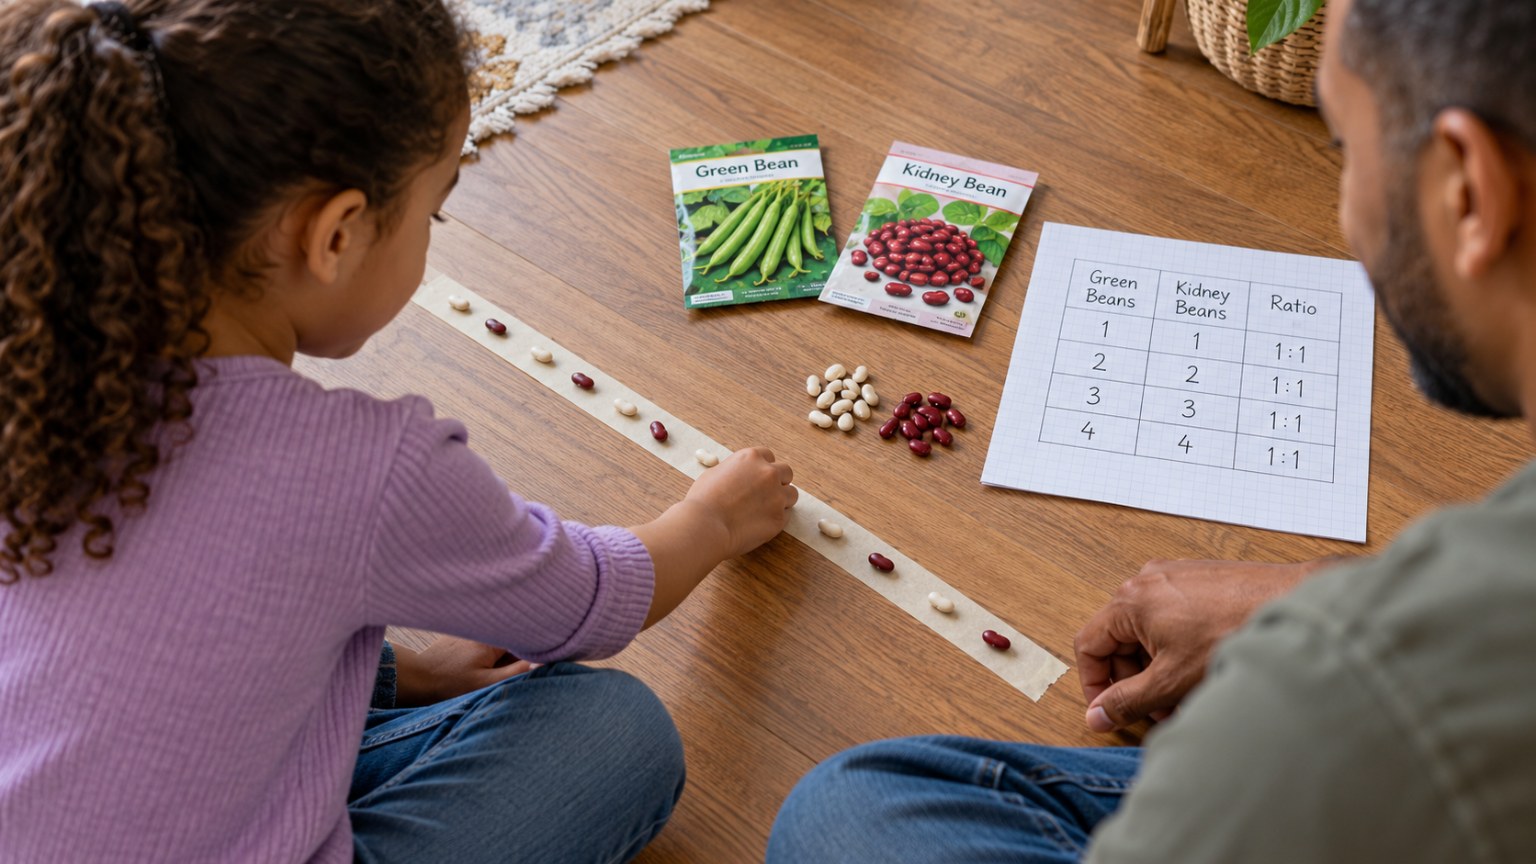
(12 min) Your teen completes ratio tables to predict populations in a reserve twice as large and in a smaller reserve, keeping the predator-to-prey ratio the same. Optional: model a ratio with two colors of beans to see it visually.
4Step 4
Find unit rates
(10 min) Your teen solves the unit rate problems, such as prey animals per predator and animals per square kilometer. They compare unit rates to decide which reserve has the most crowded predators.
5Step 5
Explain the ecology
(6 min) Read the ecology section together. Your teen writes 2 or 3 sentences explaining why the predator-to-prey ratio is so small, using the words energy and trophic level, and checks their opening guess.
Conclusion
Ask: what would happen to the lions if a drought cut the zebra and wildebeest populations in half? How do ratios help conservation scientists plan?
Make your own lesson plan in minutes
Describe a topic and Resource Portal AI writes the objectives, materials and steps for your group.
Try Resource Portal AI