Free lesson plan

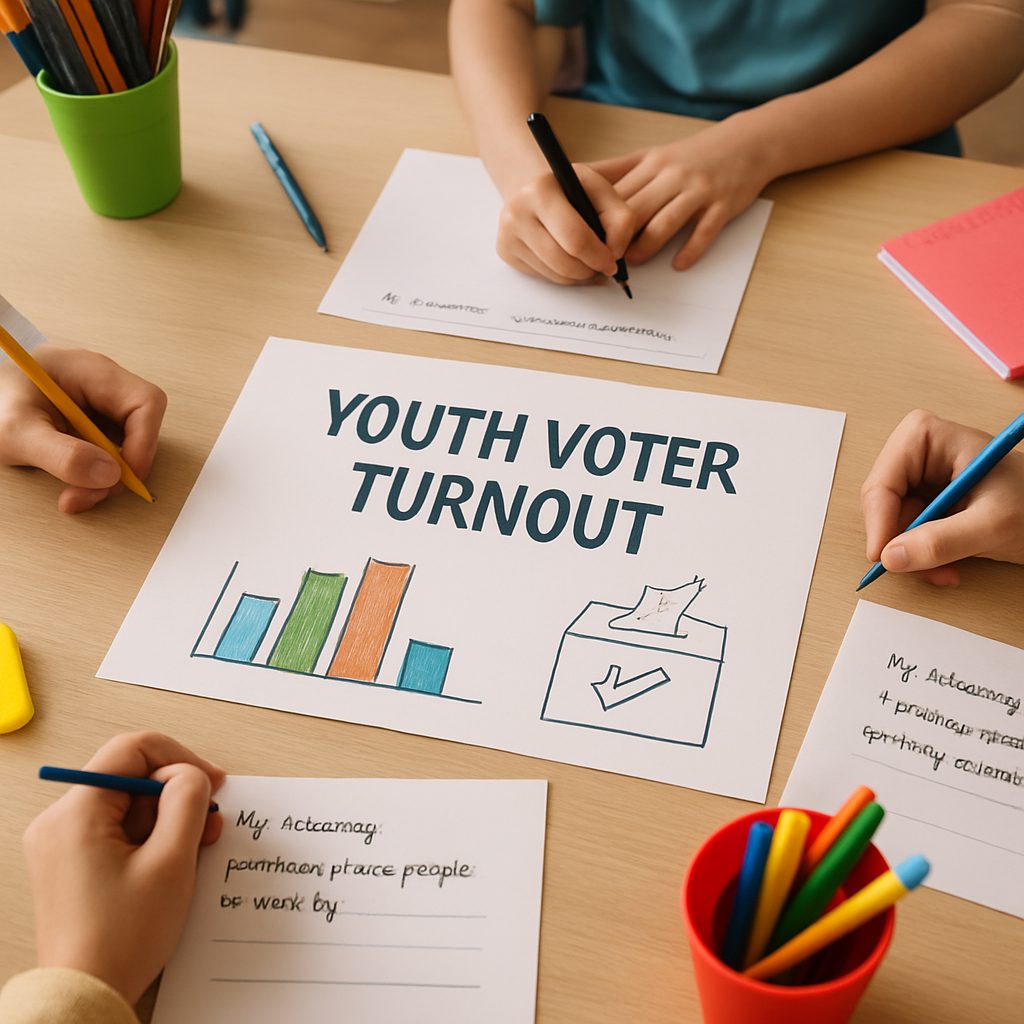
Youth Voter Turnout Data Lab

STEAM1 HourGrades: 11th, 12th
Youth Voter Turnout Data Lab

Overview

Students will analyze youth voter turnout data to understand trends and propose strategies to enhance participation rates among their peers.

Description

This lesson guides students in analyzing youth voter turnout data from the U.S. Census Bureau, fostering critical thinking and collaboration as they interpret statistics and propose actionable solutions to increase voter participation among their peers.

Objective

Students will analyze youth voter turnout data and collaboratively propose strategies to increase voter engagement among young people.

Materials

ItemQuantity
Youth Voter Turnout Data Sets from U.S. Census Bureau5 sets
Computers/Tablets5 units
Graphing Software or Tools5 licenses
Presentation Software5 licenses
Projector1 unit
Chart Paper5 sheets
Graph Paper20 sheets
Turnout Data Tables5 sets
Short Video on Youth Voter Turnout1 unit

Vocabulary

Data Analysis
The process of examining and interpreting data to discover meaningful insights.
Voter Turnout
The percentage of eligible voters who cast a ballot in an election.
Statistical Trend
A pattern or trend in data that indicates a direction of change.
Engagement Strategies
Methods or techniques used to engage a specific group in a certain activity.
Collaboration
Working together with others to achieve a common goal.
Presentation
A means of sharing information with an audience effectively.

Preparation

Introduction

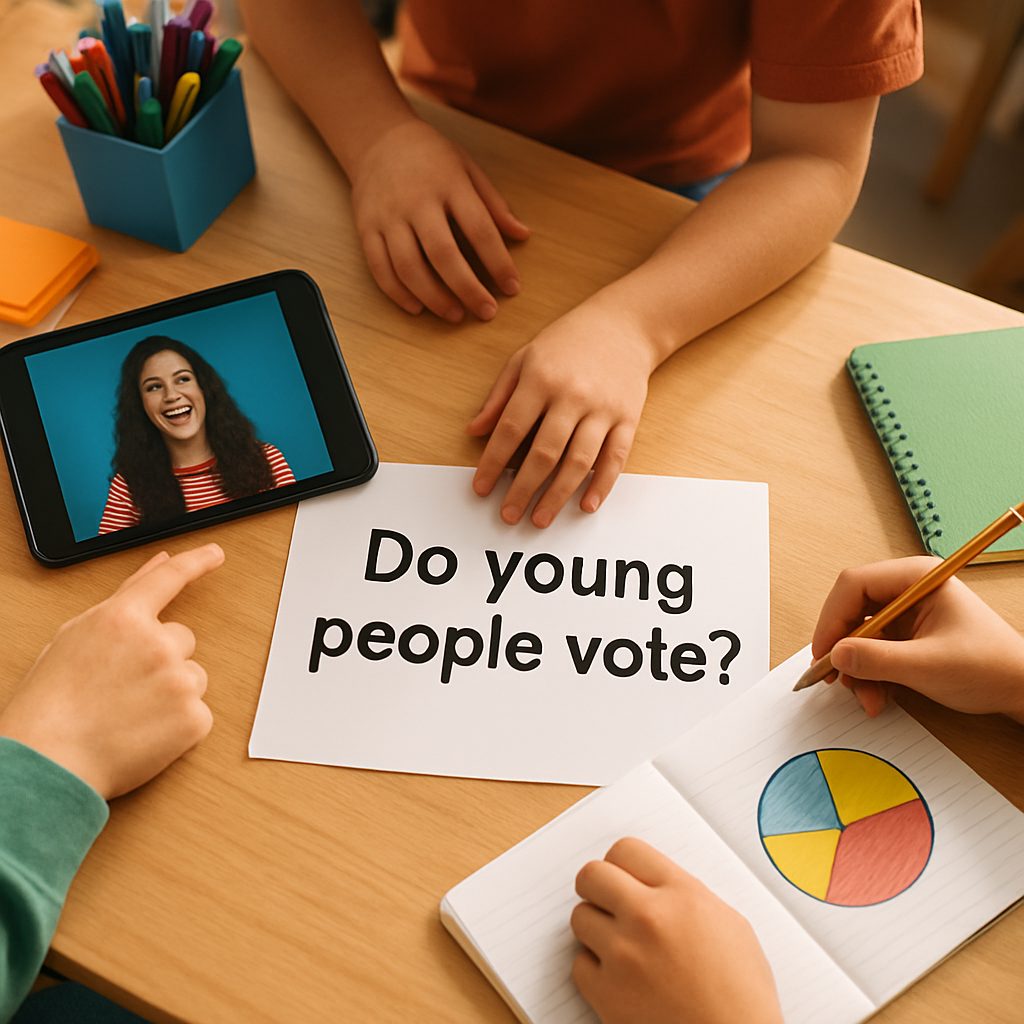
Do young people vote? Discuss why their participation matters and what they think influences young voters.
Why is voter turnout among young people important?
What factors do you think affect youth participation in elections?

Steps
1Step 1
Hook
(5 min) Begin with a brief discussion about youth voter turnout. Ask, 'Why do you think young people choose to vote or not to vote?' This engages students immediately and sets the tone for the lesson. Students will share their thoughts in small groups before moving to the next step.
Step 1
2Step 2
Analyze Data
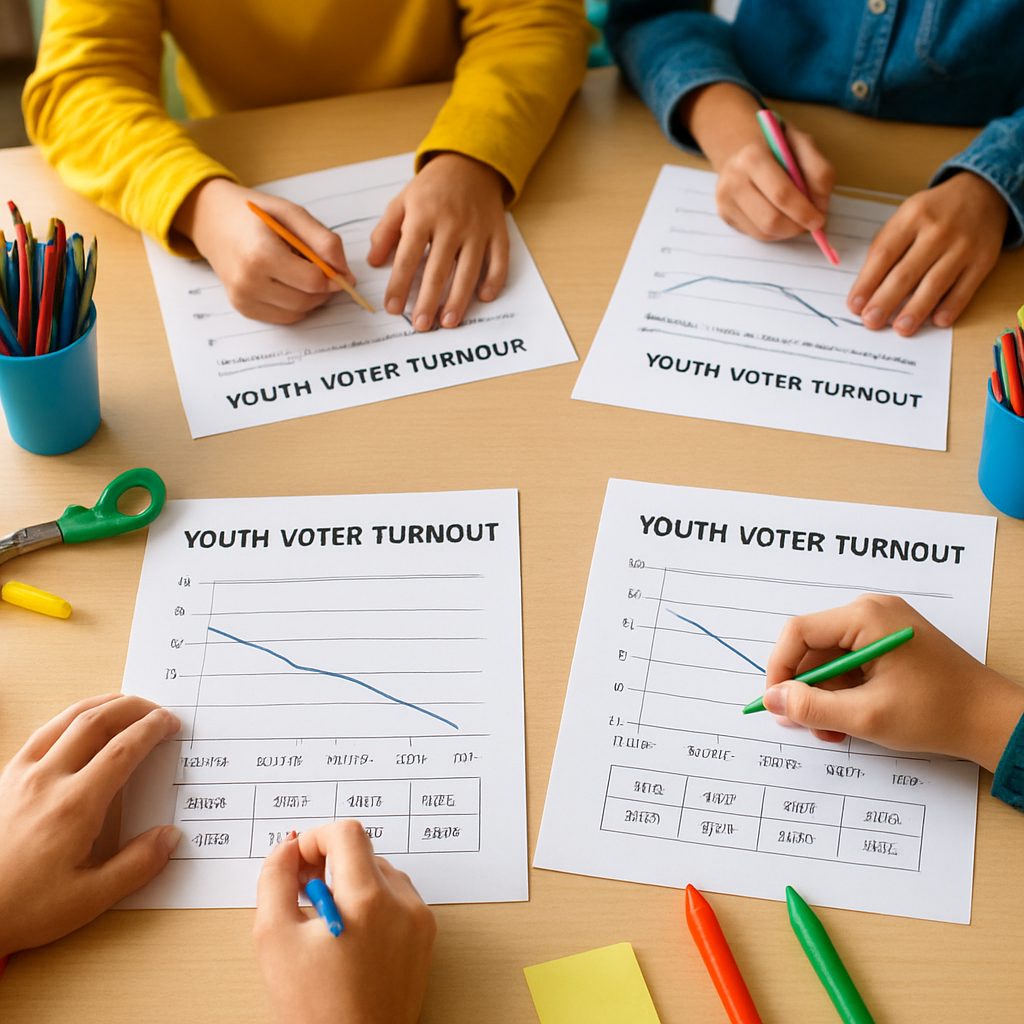
(10 min) Organize students into 5 groups of 4 and distribute 1 Youth Voter Turnout Data Set per group, sourced from the U.S. Census Bureau. The teacher says, 'Look for any patterns in the data that might explain why youth turnout is low.' Each group will analyze the data to identify turnout rates by age. Students will note their findings on a shared document, creating a summary of trends and patterns, which will be referenced later in their presentations.
Step 2
3Step 3
Create Charts
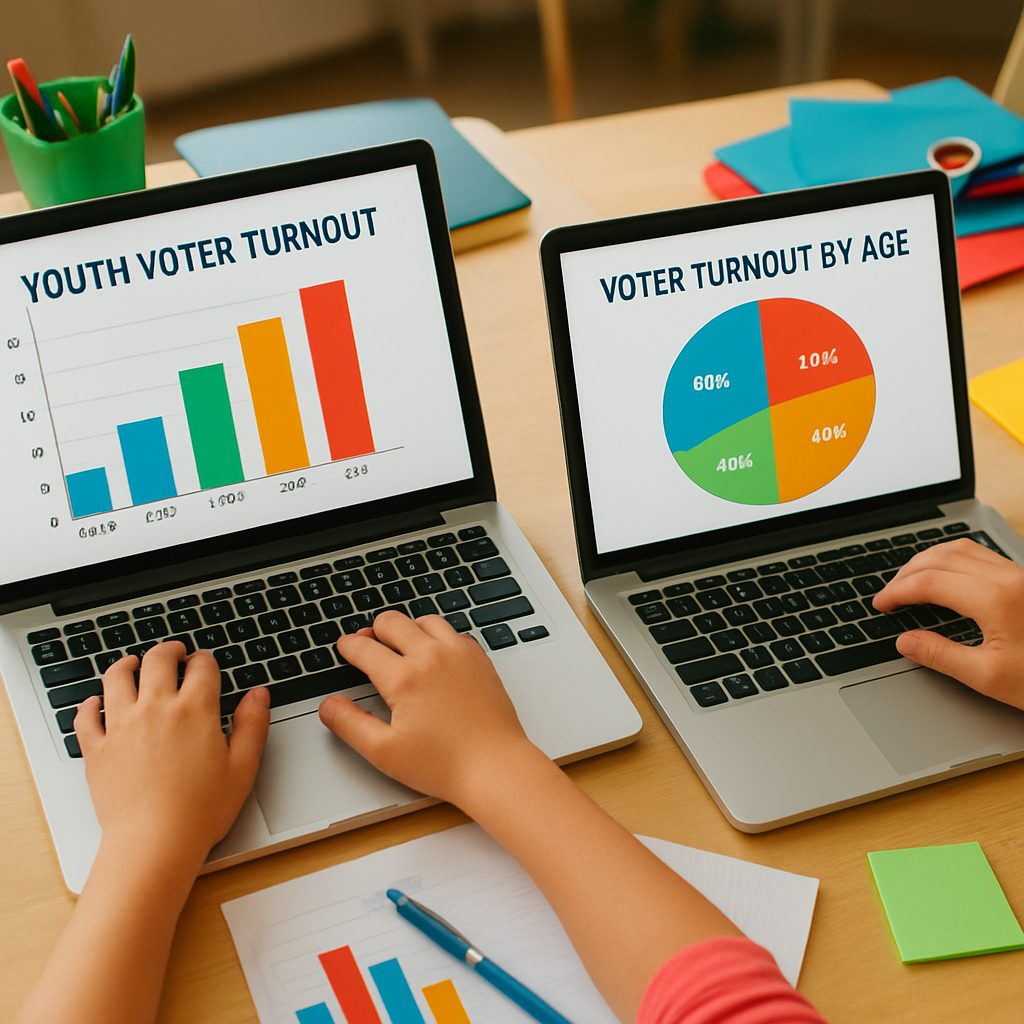
(20 min) Each group will create visual representations of the data they've analyzed using Graphing Software on their computers. The teacher encourages, 'Be creative in how you present your data; visuals should tell a story.' They will use their findings to create charts that depict turnout rates across different age groups. The finished work will consist of a series of graphs displayed on their computers, ready for presentation to the class.
Step 3
4Step 4
Develop Strategies
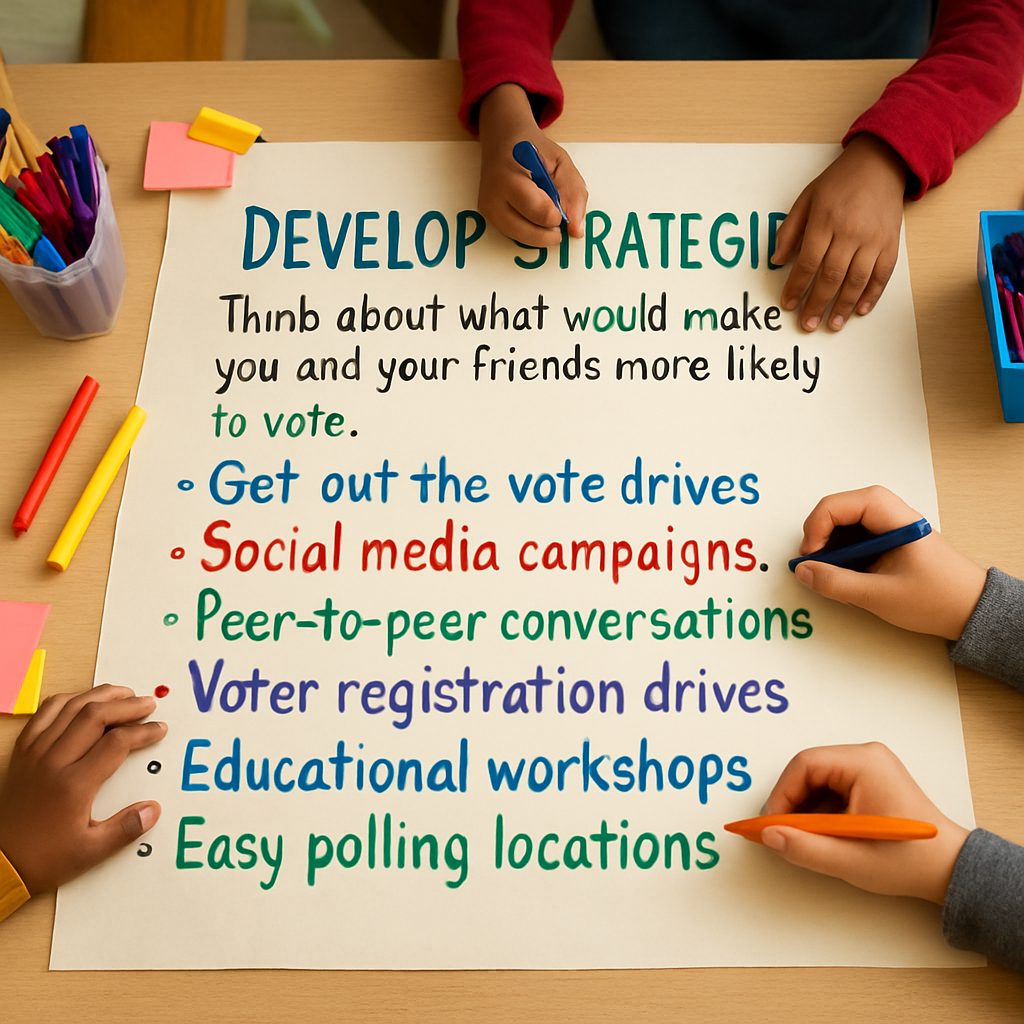
(15 min) Groups will brainstorm research-based strategies to boost youth voter turnout based on their findings. The teacher prompts, 'Think about what would make you and your friends more likely to vote.' Each group will outline their strategies on chart paper, ensuring clarity and creativity in their presentation. The finished product will be a large chart detailing their proposed strategies for increasing participation, which will serve as a visual aid during their presentations.
Step 4
5Step 5
Prepare Presentations
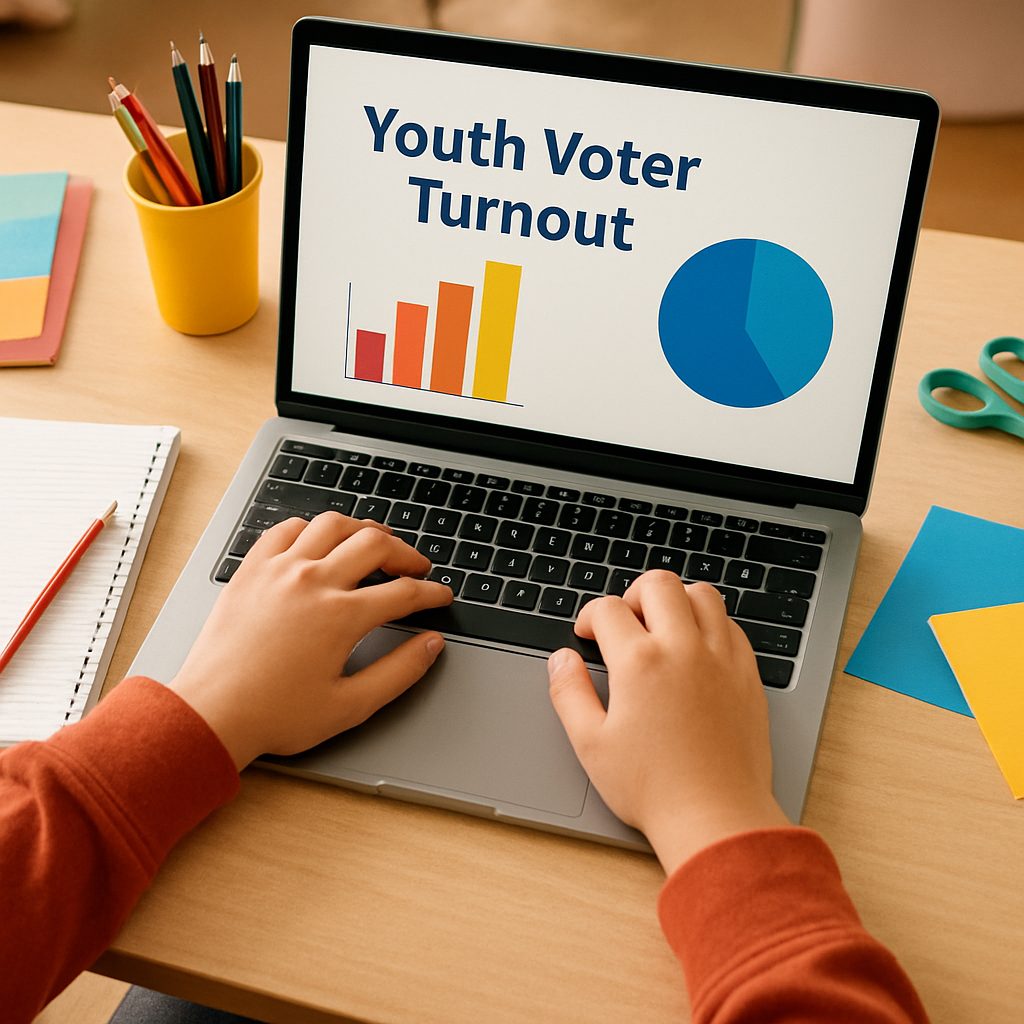
(5 min) Groups will prepare a concise presentation summarizing their findings and proposed strategies using Presentation Software on their computers. The teacher advises, 'Keep it clear and engaging; focus on what matters most.' Each group will create a brief slideshow that highlights their data analysis and strategies. The final presentations will be ready for sharing with the class, showcasing their collaborative efforts and insights.
Step 5
6Step 6
Reflection
(5 min) Conclude with a reflection where each student shares or writes down one takeaway about youth voter turnout and ways to encourage participation. This allows students to synthesize what they've learned and consider actionable steps they can take in their communities.
Step 6

Conclusion

Discuss the impact of youth voter turnout in their communities, encouraging students to think about how they can motivate their peers to vote. Reflect on the strategies developed and their potential effectiveness in increasing participation.

Make your own lesson plan in minutes

Describe a topic and Resource Portal AI writes the objectives, materials and steps for your group.

Try Resource Portal AI