Free lesson plan

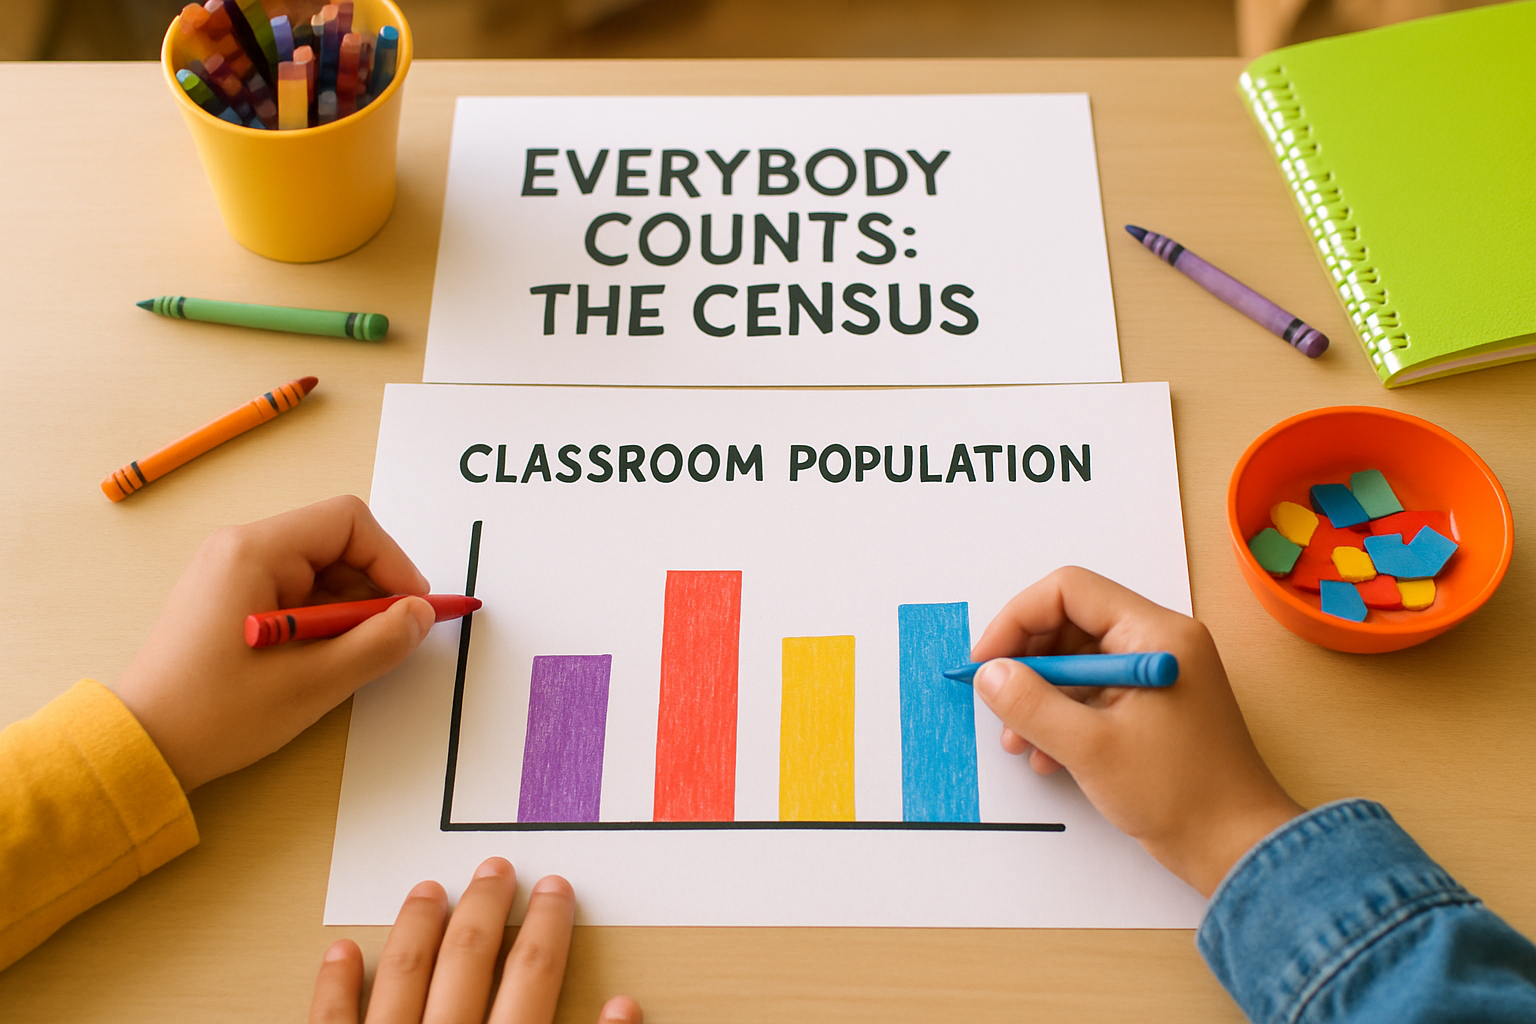
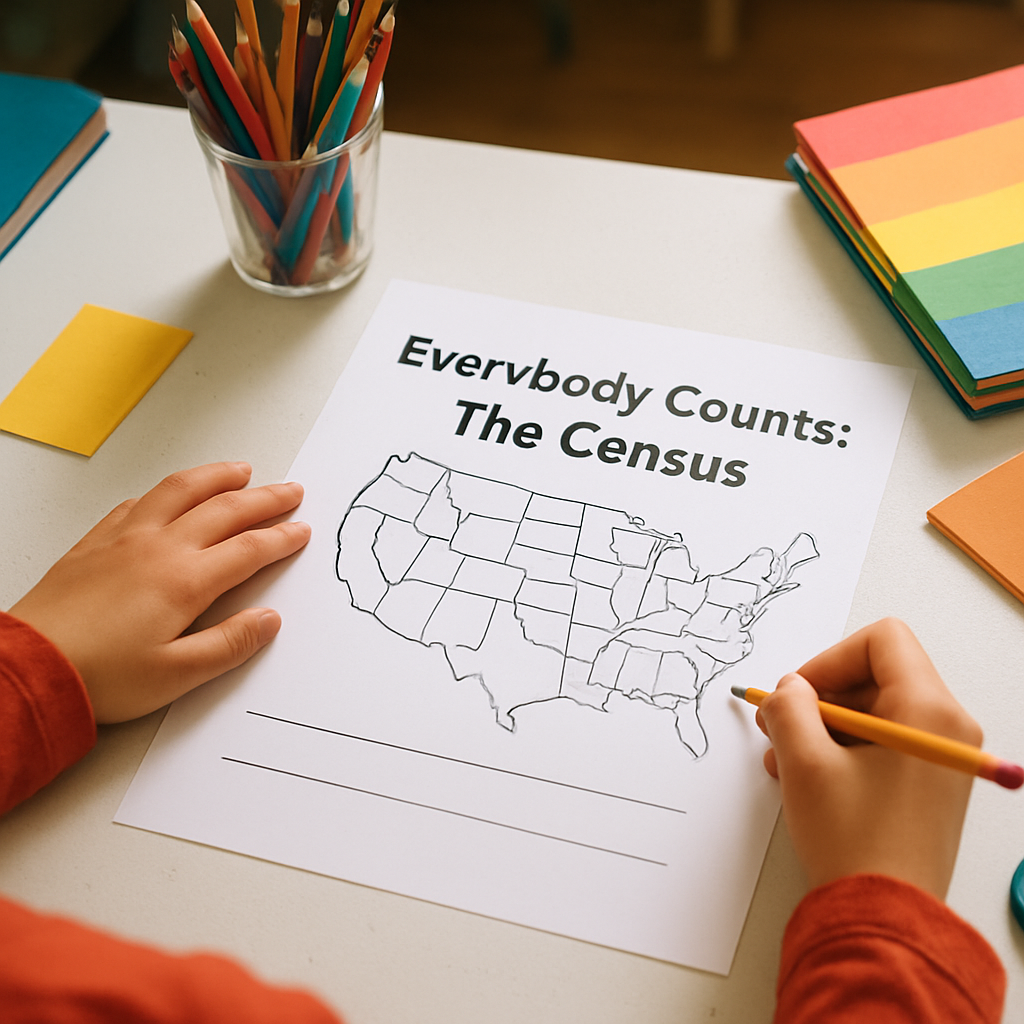
Everybody Counts: The Census
STEAM1 HourGrades: 4th, 5th
Everybody Counts: The Census

Overview

Explore the significance of the census and engage in a collaborative project to visualize data relevant to your community.

Description

In this lesson, students will learn about the importance of the U.S. census, how it impacts their community, and collaborate to create a visual representation of data related to their classroom or school. They will engage in a mini-census activity and present their findings creatively.

Objective

Students will understand the concept of the U.S. census and its importance, and they will collaboratively create a visual representation of data.

Standards

5.MDMath · Grade 5 · Measurement & Data
Measurement and Data

Materials

ItemQuantity
Poster Board5 sheets
Markers20 pieces
Sticky Notes100 pieces
Rulers5 pieces
Data Collection Sheets20 sheets
Colored Pencils40 pieces
Graph Paper20 sheets

Vocabulary

Census
An official count or survey of a population, typically recording various details of individuals.
Data
Facts and statistics collected for reference or analysis.
Population
The total number of people inhabiting a particular area or community.
Survey
A method of gathering information from individuals, usually by asking questions.
Graphs
Visual representations of data, such as charts or graphs.

Preparation

Introduction

Did you know that the census helps decide how many representatives each state gets in the House? Let's discover how counting people can shape our communities and government.
What do you think the census is?
Why do you think counting people in a community is important?

Steps
1Step 1
Introduction to the Census
(5 min) Introduce the lesson by explaining that the U.S. census happens every 10 years and affects representation in the House and federal funding. Ask the students, "Why is counting people in our community important?" Gather their thoughts on the significance of data.
Step 1
2Step 2
Conducting the Mini-Census
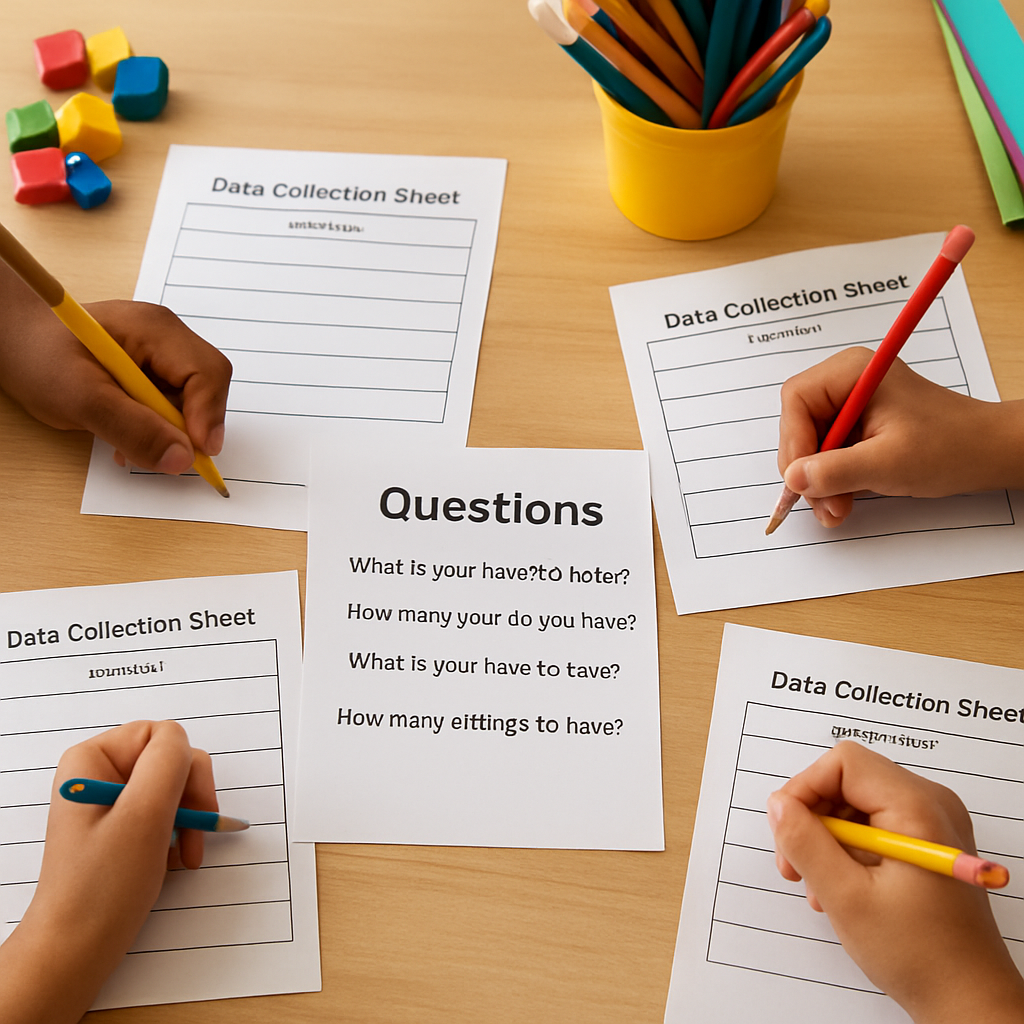
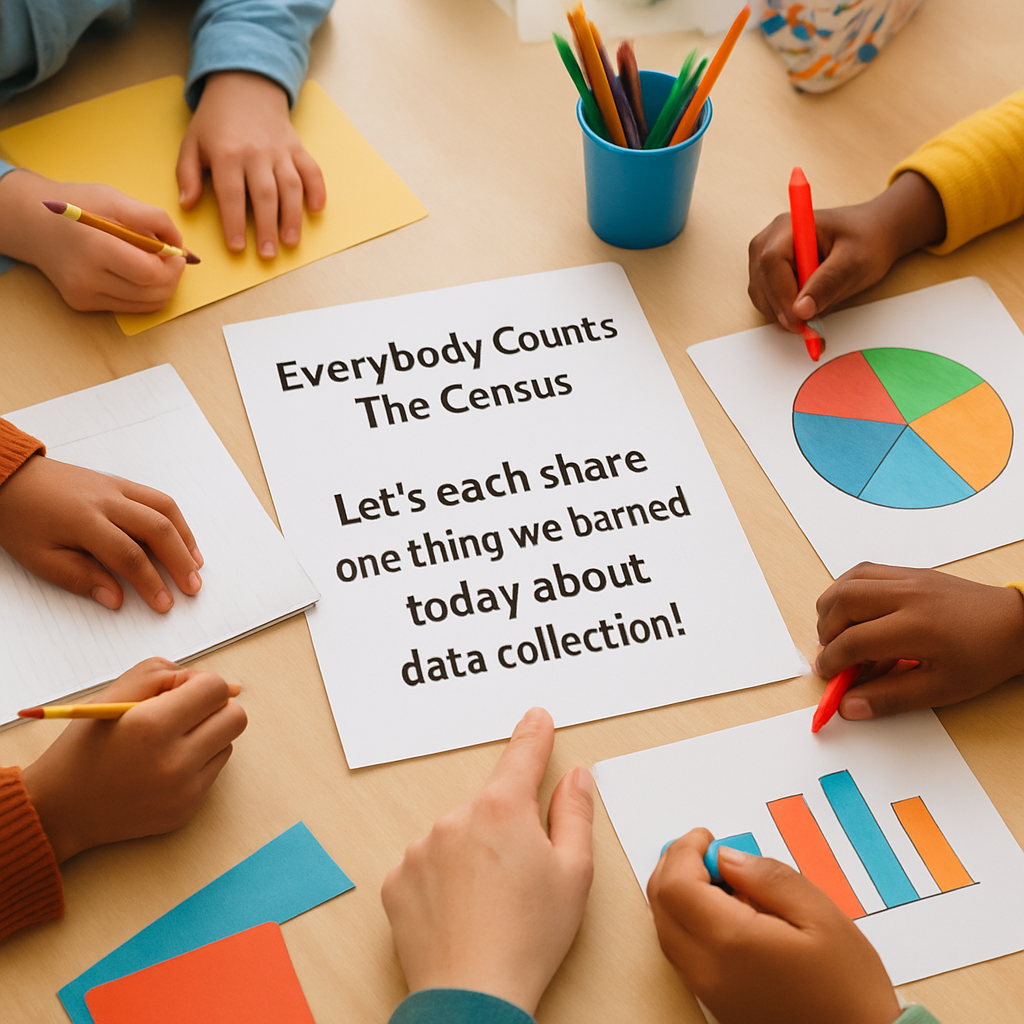
(10 min) Organize students into 5 groups of 4. Each group will receive 4 Data Collection Sheets and a set of questions to conduct a mini-census among themselves. The teacher will say, "Ask your classmates about their favorite color or how many pets they have!" Each student will fill out the Data Collection Sheets with their answers, and by the end, each group will have collected data on various topics and written it down clearly for reference.
Step 2
3Step 3
Organizing Data
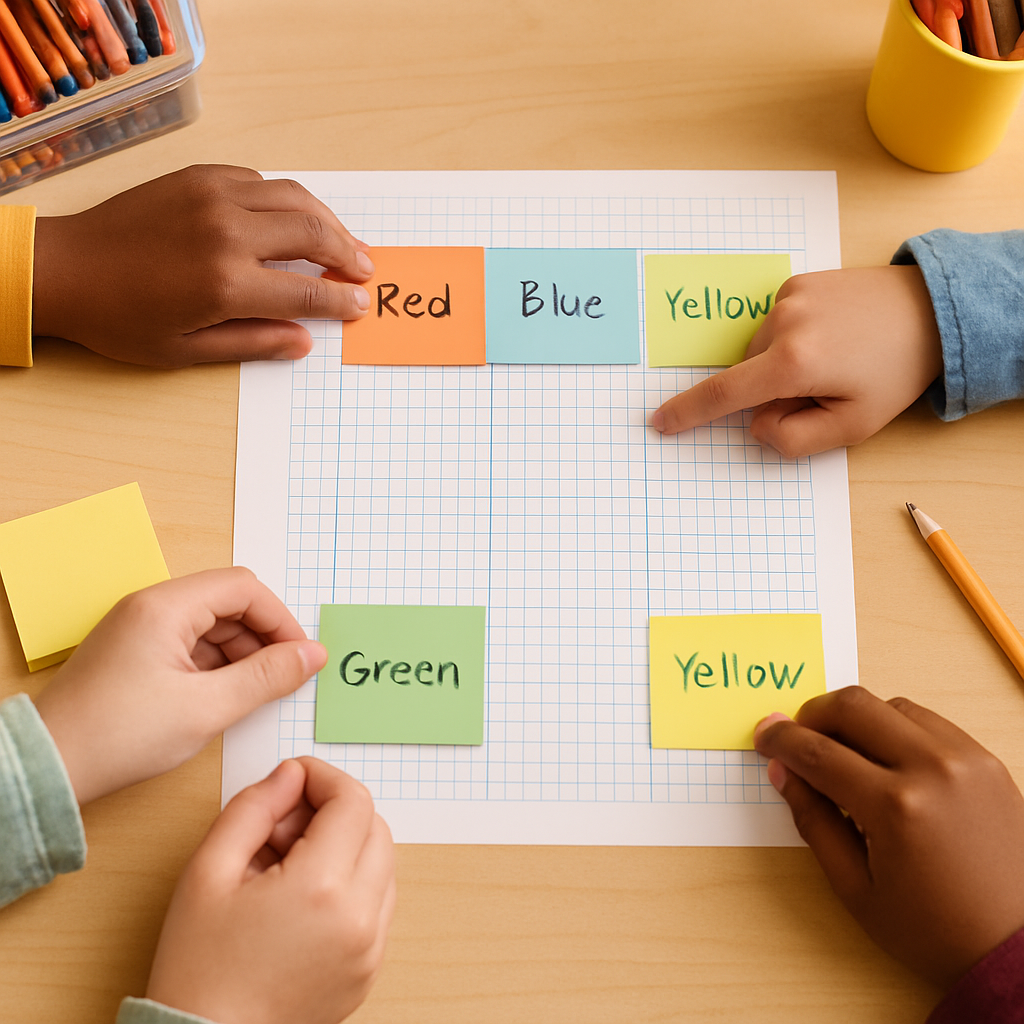
(15 min) Each group will categorize their collected data and prepare to create a visual representation. The teacher will guide them by saying, "Now, let's organize our data in a way that will make it easy to graph!" Students will use 1 sheet of Graph Paper per group to create a chart that outlines their data categories. They will also use Sticky Notes to label each category clearly, ensuring that their data is organized for presentation.
Step 3
4Step 4
Creating Visual Representations
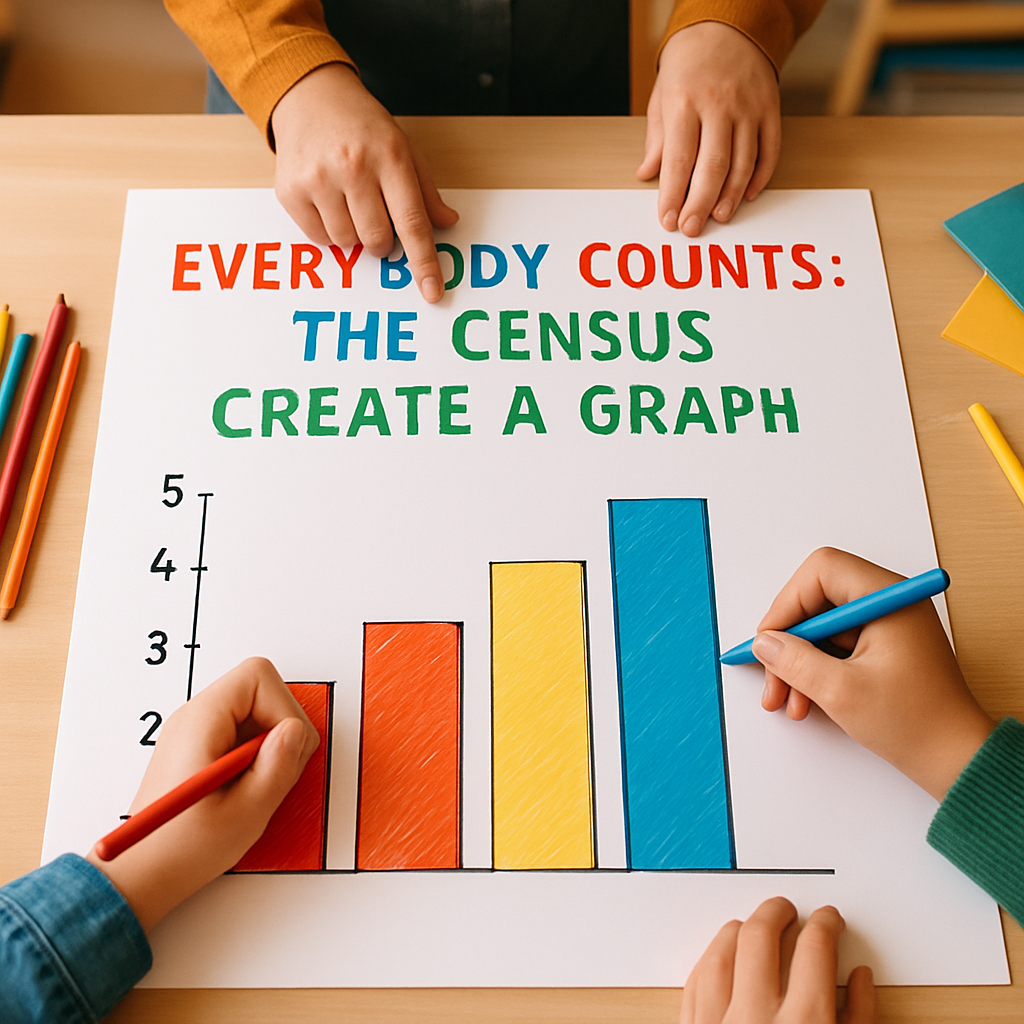
(20 min) Using their organized data, each group will create a graph on their poster board using markers and colored pencils. The teacher will encourage them by saying, "Make your graphs colorful and easy to read!" They will each use 1 Poster Board and share 8 colored pencils to visually represent their findings. The final product will be a colorful graph that clearly shows their group's data in an engaging way.
Step 4
5Step 5
Presenting Their Findings
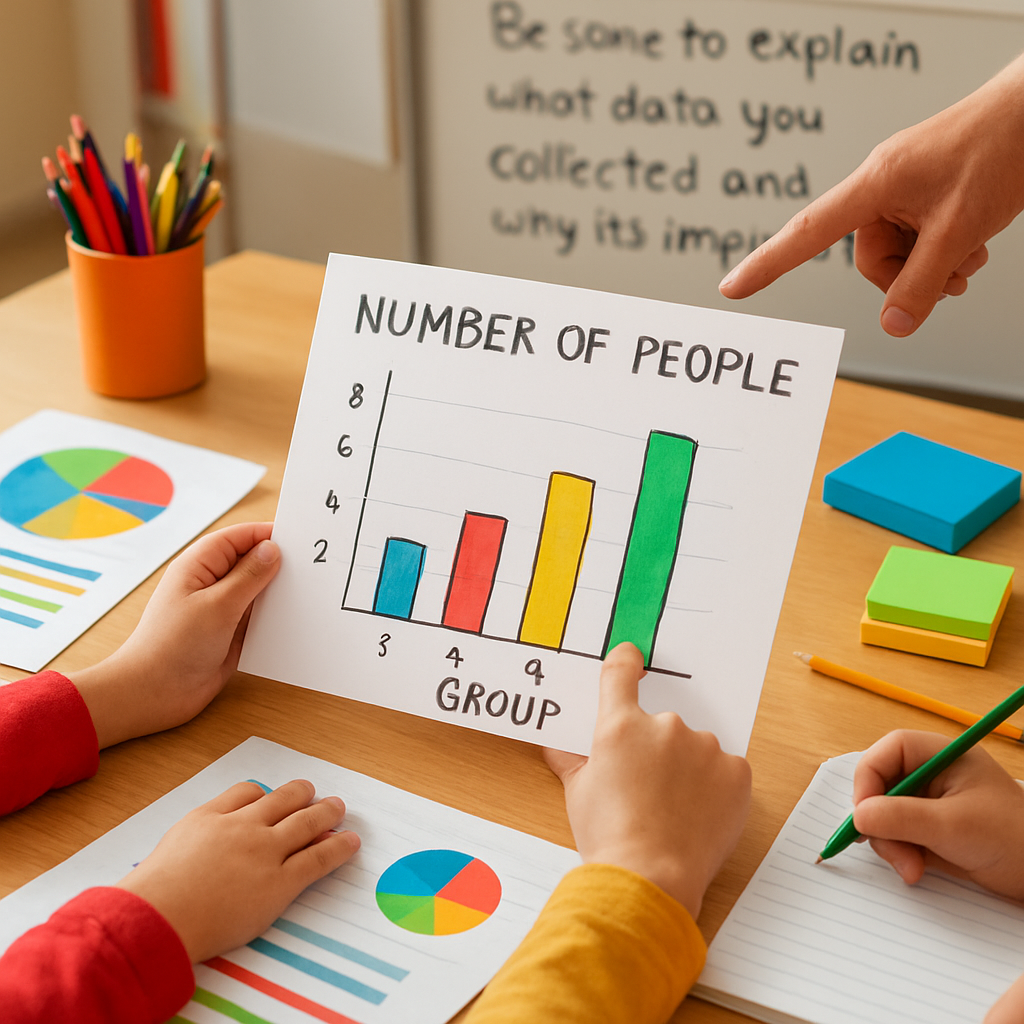
(5 min) Each group will present their visual representation to the class. The teacher will remind them, "Be sure to explain what data you collected and why it's important!" They will take turns presenting their graphs, explaining what their data shows about their group. After each presentation, students will be encouraged to ask questions for further engagement, fostering a classroom discussion about their findings.
Step 5
6Step 6
Reflection
(5 min) Reflect as a class on what they learned about the U.S. census and its importance. The teacher will say, "Let's each share one thing we learned today about data collection!" Each student will take turns sharing their insights, discussing how data collection impacts their community and reinforcing their understanding of the lesson's key concepts.
Step 6

Conclusion

As a class, reflect on the significance of the U.S. census, which happens every 10 years and affects House representation and federal funding. Students will share what they learned about data collection and how it impacts their community.

Make your own lesson plan in minutes

Describe a topic and Resource Portal AI writes the objectives, materials and steps for your group.

Try Resource Portal AI