Lesson planSports Day Beanbag Throw: A Line Plot in Fractions of a Foot
Math40 minutesGrades: 3rd, 4th
Overview
Throw, measure in quarter feet and build a line plot.
Description
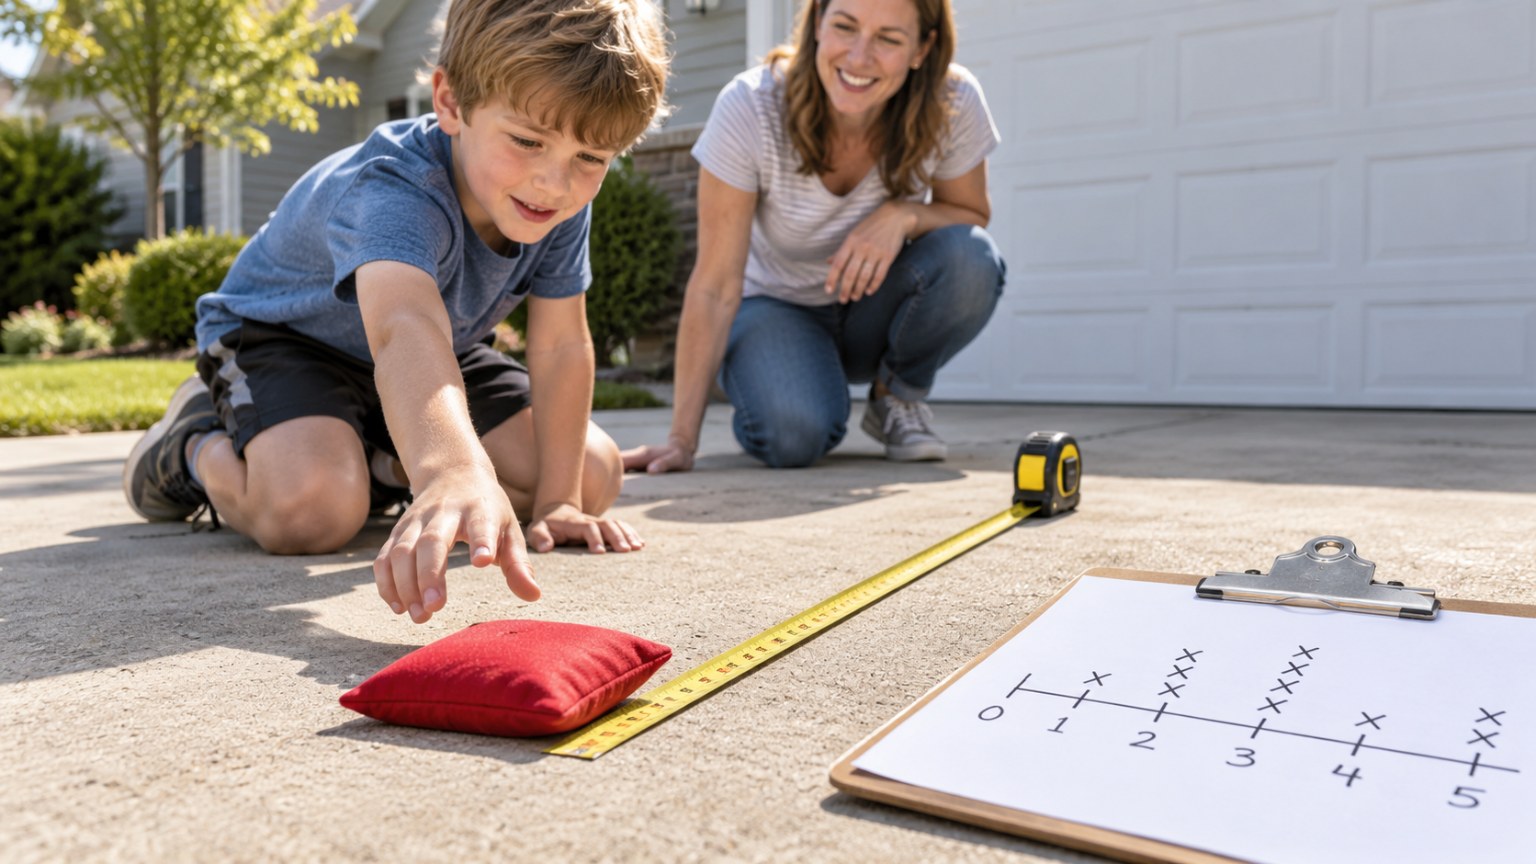
Your child runs a sports-day beanbag throw, measures each landing to the nearest quarter foot, records the results on a line plot and uses fraction addition and subtraction to answer questions about the best throw, the most common distance and the spread.
Objective
Your child will measure distances to the nearest quarter foot, display the data on a line plot, and solve problems by adding and subtracting fractions with like denominators from the plot.
Standards
3.MD.4Math · Grade 3 · Measurement & Data Generate measurement data by measuring lengths using rulers marked with halves and fourths of an inch. Show the data by making a line plot, where the horizontal scale is marked off in appropriate units— whole numbers, halves, or quarters.
4.MD.4Math · Grade 4 · Measurement & Data Make a line plot to display a data set of measurements in fractions of a unit (1/2, 1/4, 1/8). Solve problems involving addition and subtraction of fractions by using information presented in line plots.
Materials
| Item | Quantity |
|---|
| Beanbag, or a pair of socks rolled tightly into a ball | 2-3 |
| Tape measure (25-foot or longer) | 1 |
| Sidewalk chalk or painter's tape | 1 |
| Graph paper or lined paper and a pencil | 2 sheets |
| Open yard, driveway or hallway at least 15 feet long | 1 |
Vocabulary
Line plot
A number line with X marks above it to show how often each value happens.
Quarter foot
One fourth of a foot, which is 3 inches.
Range
The difference between the biggest and smallest value.
Mode
The value that appears most often in a set of data.
Preparation
- Mark a throwing line with chalk or tape. Lay the tape measure out from the line and leave it in place.
- Write the quarter-foot key on paper: 3 inches = 1/4 foot, 6 inches = 1/2 foot, 9 inches = 3/4 foot.
Introduction
Throw a beanbag and measure it: 8 feet 6 inches. Ask: 'Sports day judges write this as 8 and one-half feet. How did I get that?'
How many inches are in a foot? In half a foot?
How could a picture help us see all our throws at once?
Steps
1Step 1
Warm up and throw
(10 min) After a few practice throws, your child (and any family members) takes 10 underhand throws from behind the line. After each throw, measure from the line to where the beanbag first touched down and stays.
2Step 2
Round to quarter feet
(8 min) Read each throw in feet and inches, then round the inches to the nearest quarter foot using the key: 0-1 inch rounds down to the whole foot, 2-4 inches is 1/4, 5-7 is 1/2, 8-10 is 3/4 and 11 inches rounds up to the next foot. Record each throw as a mixed number, such as 7 3/4 feet.
3Step 3
Build the line plot
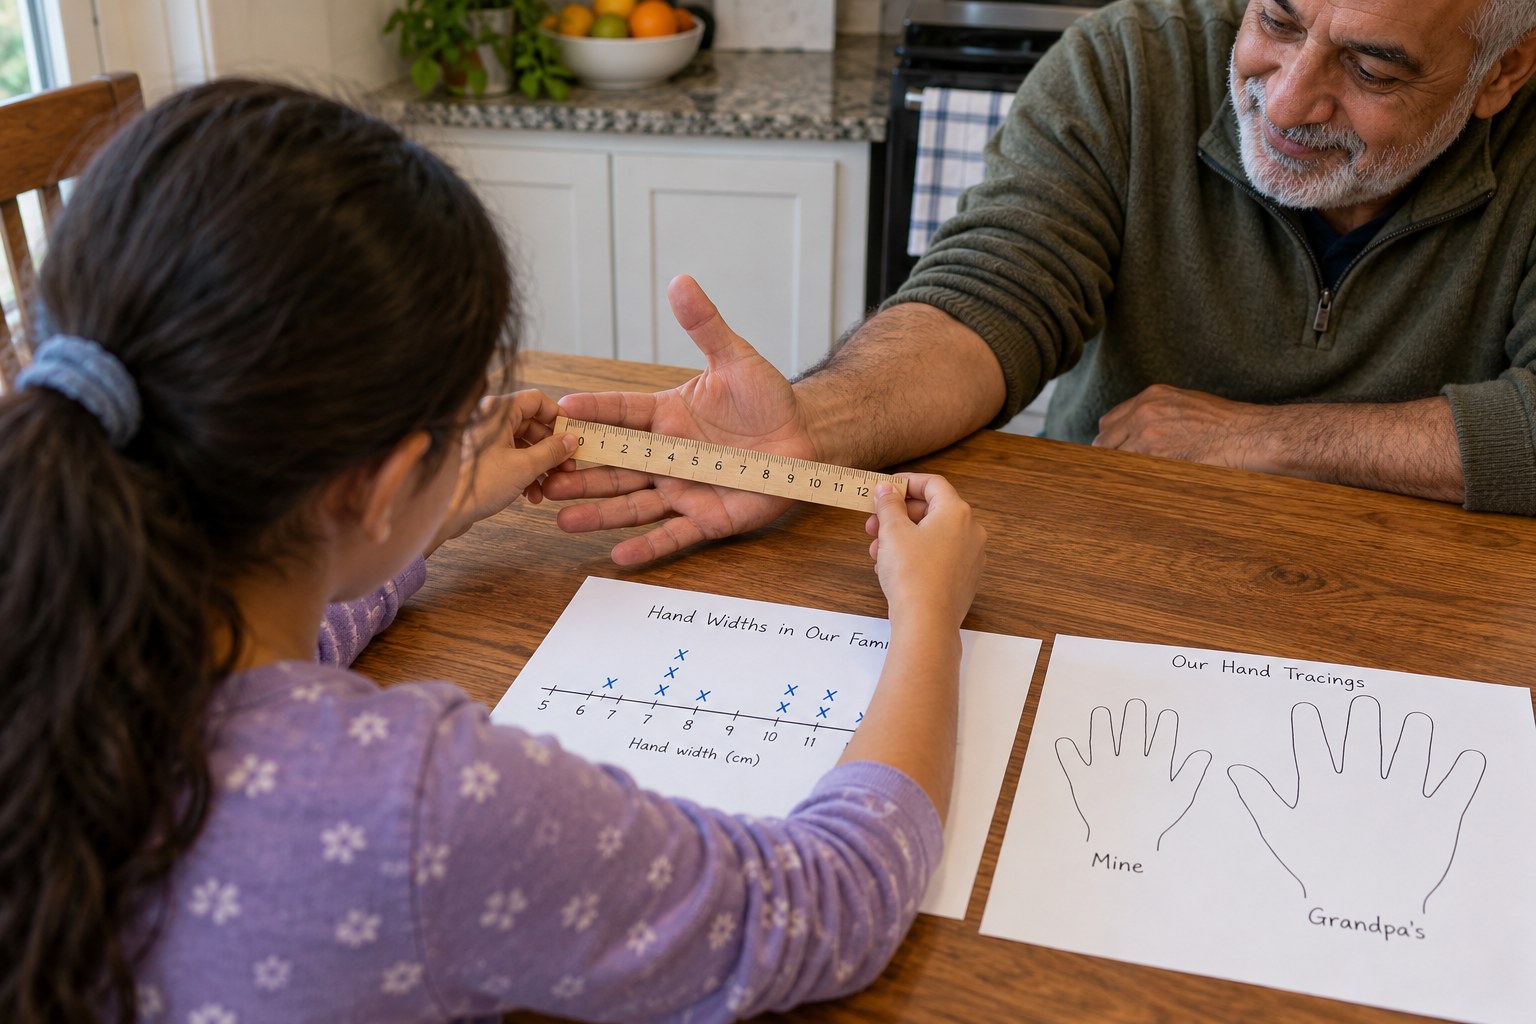
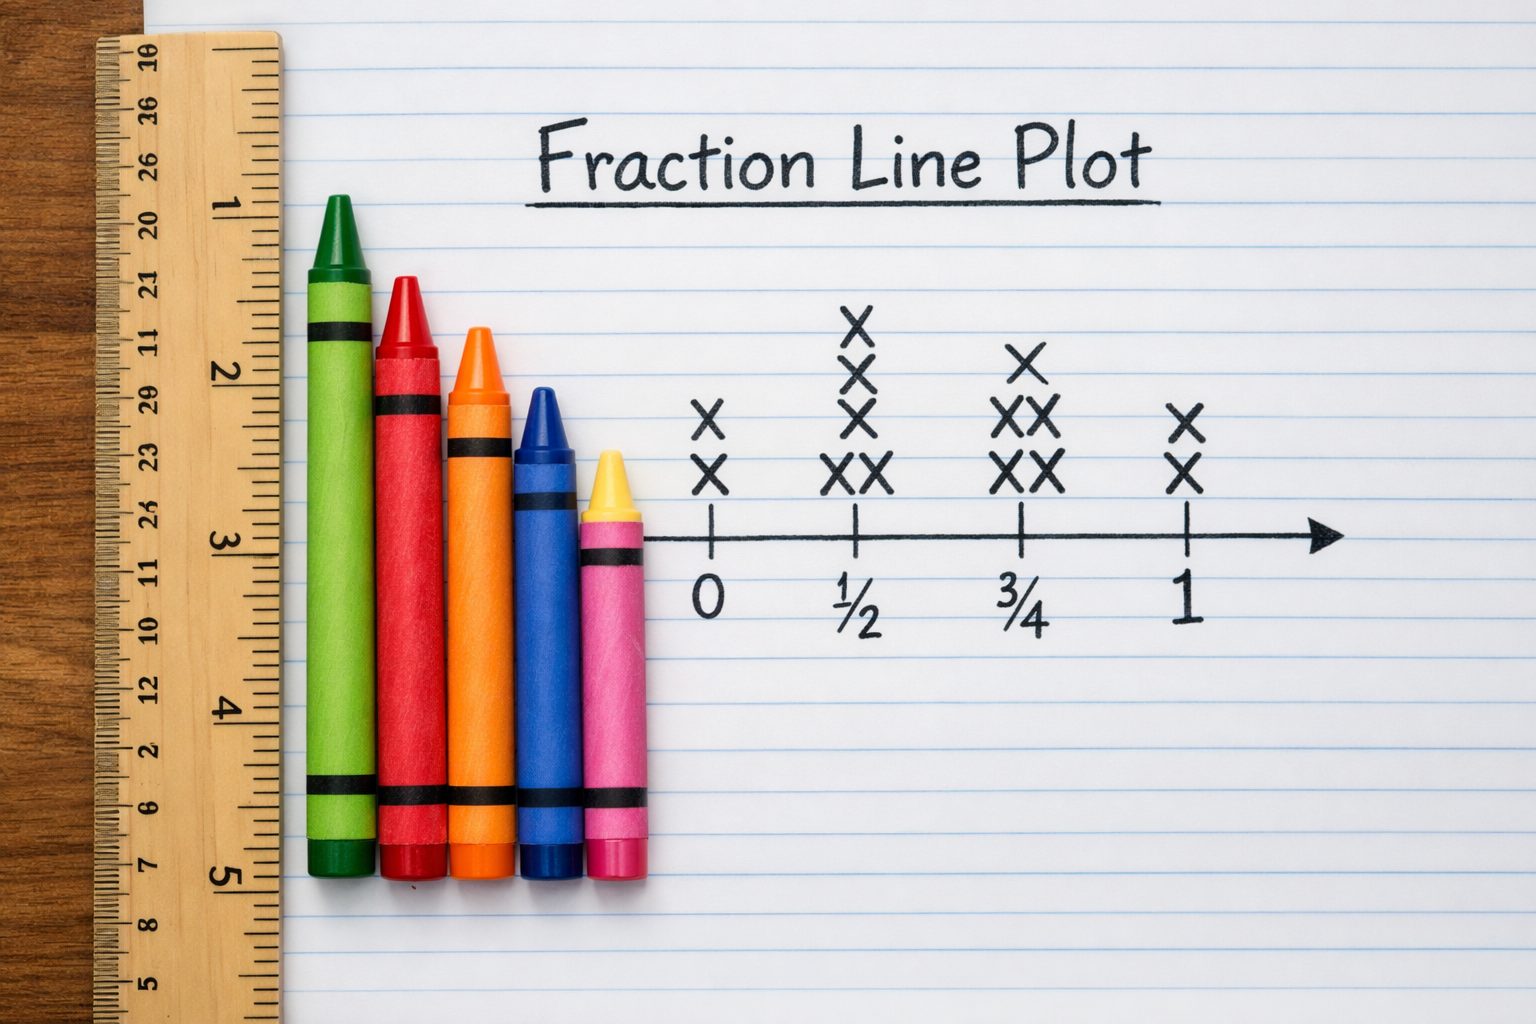
(10 min) Draw a number line from the shortest to the longest throw, marked in quarters. Your child puts an X above the matching mark for each throw so stacks show repeated distances.
4Step 4
Ask the plot
(9 min) Your child answers: What was the longest throw? The shortest? What is the range (longest minus shortest)? Which distance happened most? How much farther was the best throw than the most common one?
Conclusion
Ask: if you threw 10 more times, where do you think most Xs would land? Try a second round and add those Xs in a different color.
Make your own lesson plan in minutes
Describe a topic and Resource Portal AI writes the objectives, materials and steps for your group.
Try Resource Portal AI