Lesson planLeprechaun's Gold: A Probability Showdown
Math40 minutesGrades: 7th
Overview
Test a leprechaun's bet with theoretical and experimental probability.
Description
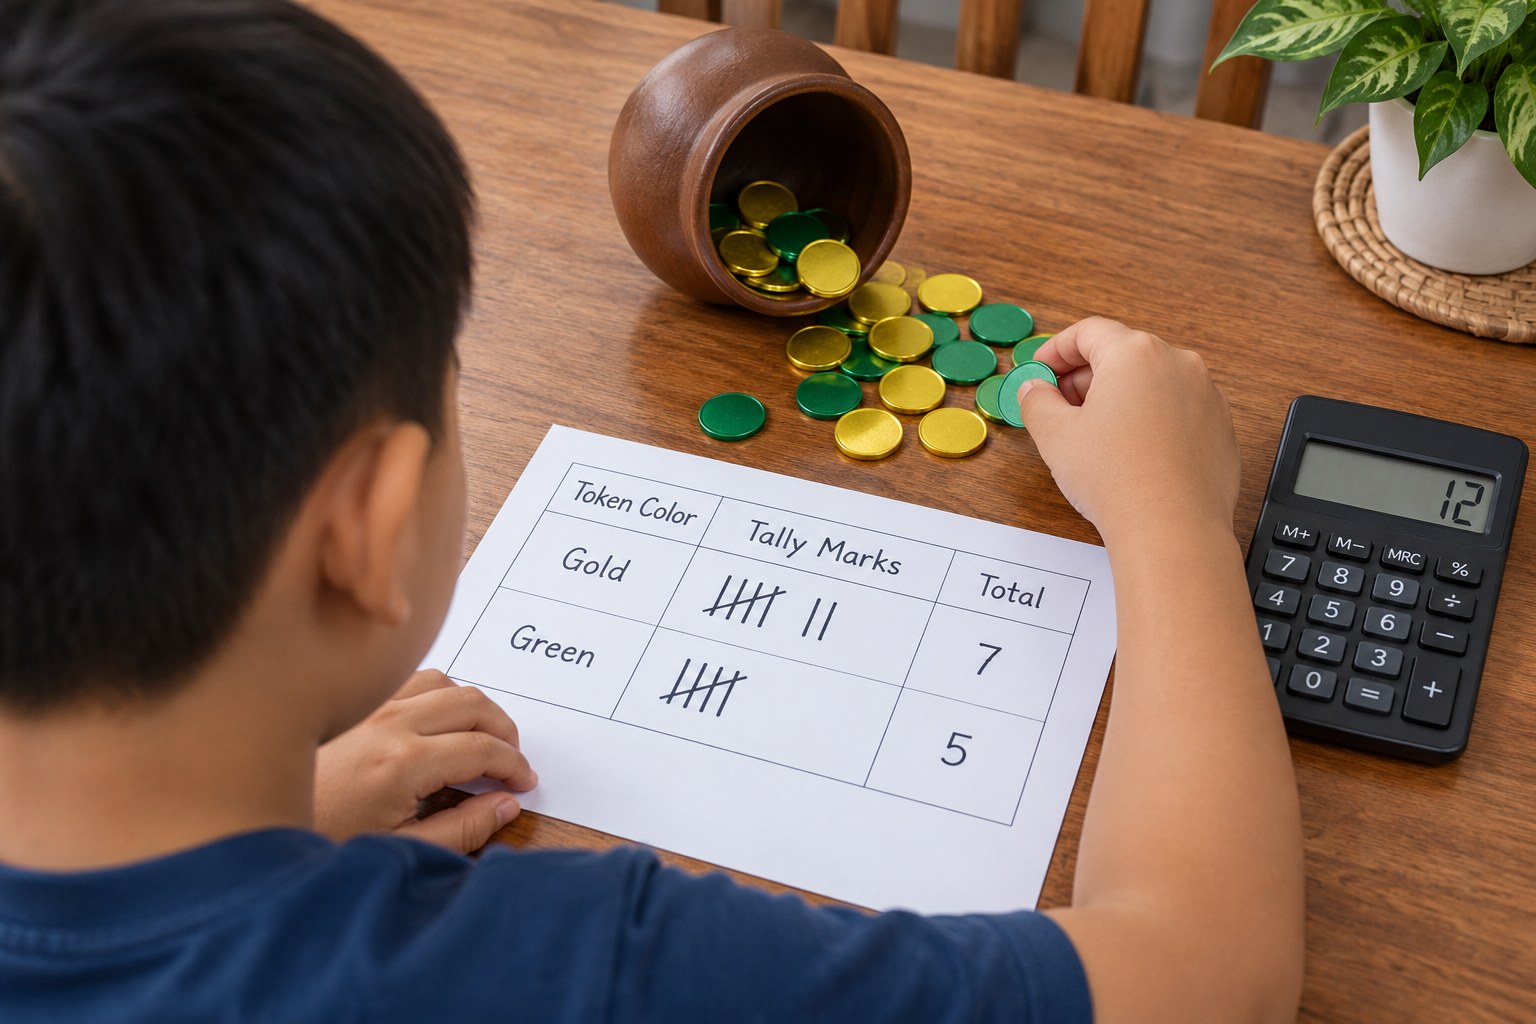
Your teen plays a St. Patrick's Day 'pot of gold' drawing game with gold and green tokens in a bag, calculates the theoretical probability of drawing gold, runs 50 trials to find the experimental probability, and decides whether a leprechaun's offered bet is fair.
Objective
Your teen will build a uniform probability model, compute theoretical probabilities, collect data to approximate experimental probability, and explain why the two may differ and how they get closer with more trials.
Standards
7.SP.6Math · Grade 7 · Statistics & Probability Approximate the probability of a chance event by collecting data on the chance process that produces it and observing its long-run relative frequency, and predict the approximate relative frequency given the probability.
7.SP.7aMath · Grade 7 · Statistics & Probability Develop a uniform probability model by assigning equal probability to all outcomes, and use the model to determine probabilities of events.
Materials
| Item | Quantity |
|---|
| Opaque bag or pot (paper bag, coffee can or pot) | 1 |
| Yellow or gold tokens (pennies, yellow paper squares, yellow buttons) | 3 |
| Green tokens (green paper squares, buttons or LEGO bricks) | 7 |
| Tally chart on paper and pencil | 1 |
| Calculator | 1 |
Vocabulary
Theoretical probability
The chance of an event based on reasoning: favorable outcomes divided by all equally likely outcomes.
Experimental probability
The chance of an event based on what actually happened in trials.
Trial
One repetition of an experiment, such as one draw from the bag.
Fair game
A game in which each player has the same expected result over many plays.
Preparation
- Put 3 gold and 7 green tokens of the same size and feel into the bag.
- Make a tally chart with columns for Trial block (1-10, 11-20, ...), Gold and Green, plus a running relative-frequency column.
Introduction
Pose the challenge: A leprechaun offers a St. Patrick's Day bet. Draw one token from his pot. Gold, and you win 2 points; green, and he wins 1 point. Should you take the bet?
What information do you need to decide if this is fair?
Would one draw tell you anything? What about 100 draws?
Steps
1Step 1
Build the model
(7 min) Your teen lists the sample space (10 tokens) and calculates P(gold) = 3/10 and P(green) = 7/10. They then compute expected points over 10 draws: you expect 3 golds worth 6 points and 7 greens worth 7 points for the leprechaun.
2Step 2
Run 50 trials
(12 min) Take turns drawing one token, recording it, and returning it to the bag before shaking. After every 10 trials, your teen calculates the cumulative relative frequency of gold as a decimal.
3Step 3
Compare
(8 min) Your teen compares the experimental probability after 10, 20 and 50 trials with the theoretical 0.3. Ask: which is closer, and why might early results bounce around?
4Step 4
Make it fair
(8 min) Your teen redesigns the game so it is fair, either by changing the points or the number of gold and green tokens. They prove it with an expected-value calculation and test it with 20 more draws if time allows.
5Step 5
Decide
(4 min) Your teen writes a two-sentence verdict on the leprechaun's original bet, using both the model and the data as evidence. Then they read it aloud and defend it if you play the leprechaun and argue back.
Conclusion
Ask: if you combined your 50 trials with another group's 50, would you expect to be closer to 0.3? Why? Teach the game to a sibling or friend on St. Patrick's Day.
Make your own lesson plan in minutes
Describe a topic and Resource Portal AI writes the objectives, materials and steps for your group.
Try Resource Portal AI