Lesson planLeaf Litter Census: Estimating Fallen Leaves with Random Samples
Math45 minutesGrades: 6th, 7th, 8th
Overview
Estimate a tree's fallen leaves with random samples.
Description
Your teen estimates how many fallen leaves cover the ground under a tree by counting leaves in randomly chosen one-foot squares, compares several random samples to a biased one, and explains why random sampling gives a better estimate.
Objective
Your teen will use random sampling to estimate the number of leaves in a large area, generate multiple samples to see how estimates vary, and explain why a representative sample matters.
Standards
7.SP.1Math · Grade 7 · Statistics & Probability Understand that statistics can be used to gain information about a population by examining a sample of the population; generalizations about a population from a sample are valid only if the sample is representative of that population. Understand that random sampling tends to produce representative samples and support valid inferences.
7.SP.2Math · Grade 7 · Statistics & Probability Use data from a random sample to draw inferences about a population with an unknown characteristic of interest. Generate multiple samples (or simulated samples) of the same size to gauge the variation in estimates or predictions.
Materials
| Item | Quantity |
|---|
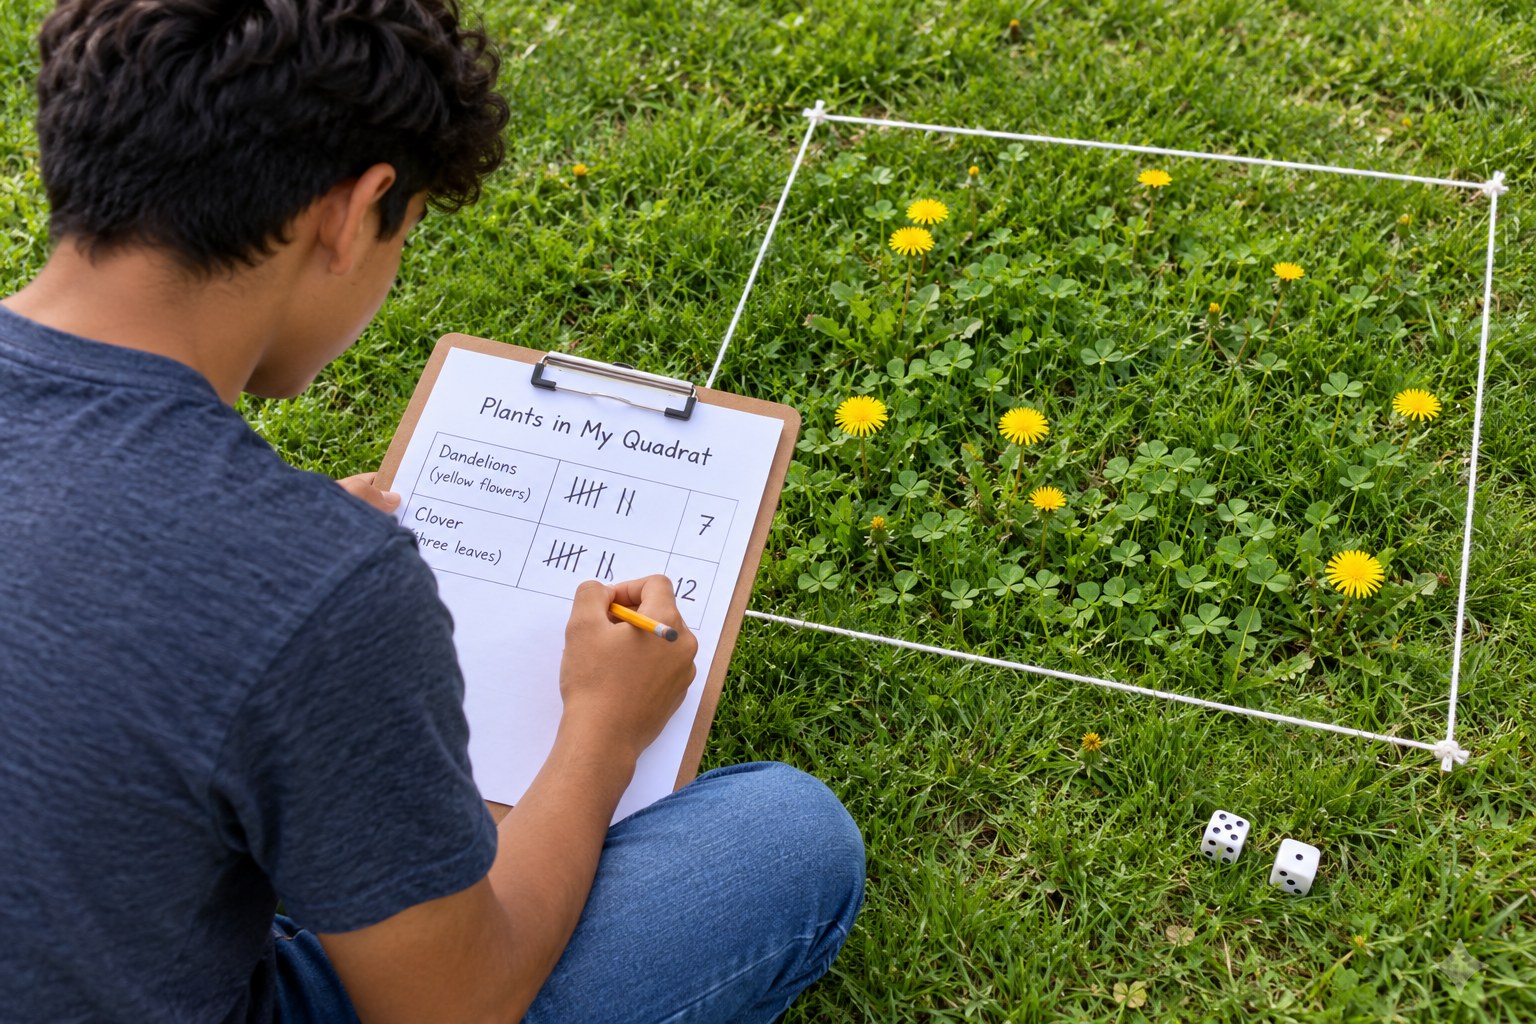
| String or a tape measure and 4 sticks to mark a 10-by-10-foot area | about 40 feet of string |
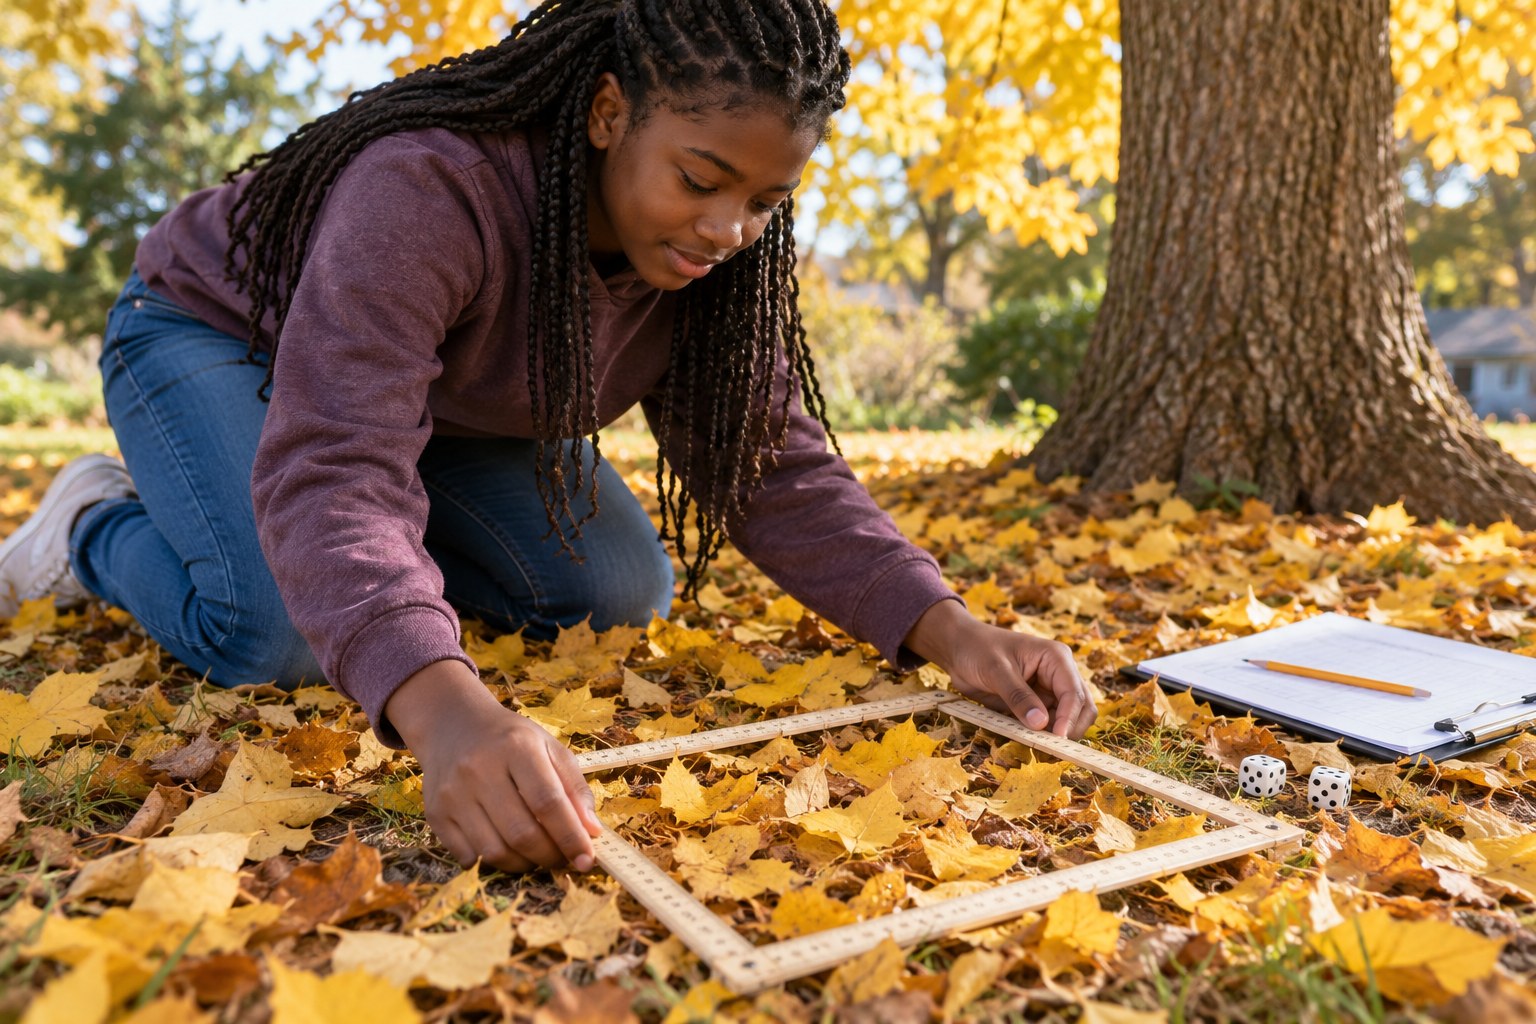
| A one-foot-square frame (4 rulers taped together, or a cardboard frame) | 1 |
| Two 10-sided dice, a random number app, or 100 numbered paper slips in a bag | 1 set |
| Clipboard, grid paper and pencil | 1 each |
| Calculator | 1 |
| Gloves (optional) | 1 pair per person |
Vocabulary
Population
The whole group you want to know about; here, every leaf in the area.
Sample
A smaller part of the population that you actually count.
Random sample
A sample where every part of the population has an equal chance of being picked.
Biased sample
A sample that is likely to give a wrong picture because it favors some parts over others.
Inference
A conclusion about the population based on sample data.
Preparation
- Find a tree whose fallen leaves cover the ground unevenly, in a yard or park, and get permission if it is not your property. Avoid areas near traffic.
- Mark off a 10-by-10-foot square on the ground with sticks and string. On grid paper, draw a 10-by-10 grid of 100 one-foot squares and number them 00 to 99 (row digit then column digit).
Introduction
Ask your teen to guess how many leaves are on the ground in the marked square. Write every family member's guess down. Counting every leaf would take hours, so how could you get a good estimate in 20 minutes?
If you only counted leaves right next to the trunk, would your estimate be too high or too low?
Why might two different samples give different answers?
Steps
1Step 1
Plan the sample
(6 min) Your teen explains the grid map: 100 one-foot squares, numbered 00 to 99. They roll the dice or use the random number app to choose 5 squares and mark them on the map.
2Step 2
Count sample 1
(10 min) For each chosen square, lay the one-foot frame on the ground in that spot and count every leaf that is at least half inside the frame. Record the counts and find the mean.
3Step 3
Make the inference
(5 min) Your teen multiplies the mean by 100 squares to estimate the total leaves in the area. Compare the estimate to the family's guesses.
4Step 4
Repeat and compare
(12 min) Choose a second and third random sample of 5 squares and repeat the count and estimate. Then take a biased sample: the 5 squares closest to the trunk or the thickest pile. Line up all four estimates on a number line.
5Step 5
Explain the results
(8 min) Your teen writes a short conclusion: how far apart were the three random estimates, how did the biased estimate compare, and what is the best estimate of the total? They suggest one way to make the estimate more reliable, such as sampling more squares.
Conclusion
Ask: if a city wanted to know how many bags of leaves to pick up on your street, how could they use sampling? Repeat the census in two weeks to measure how many more leaves have fallen.
Make your own lesson plan in minutes
Describe a topic and Resource Portal AI writes the objectives, materials and steps for your group.
Try Resource Portal AI