Lesson planInflation Detective: How Much Have Your Snacks Really Gone Up?
Math48 minutesGrades: 11th
Overview
Turn old receipts into exponential models of snack prices.
Description
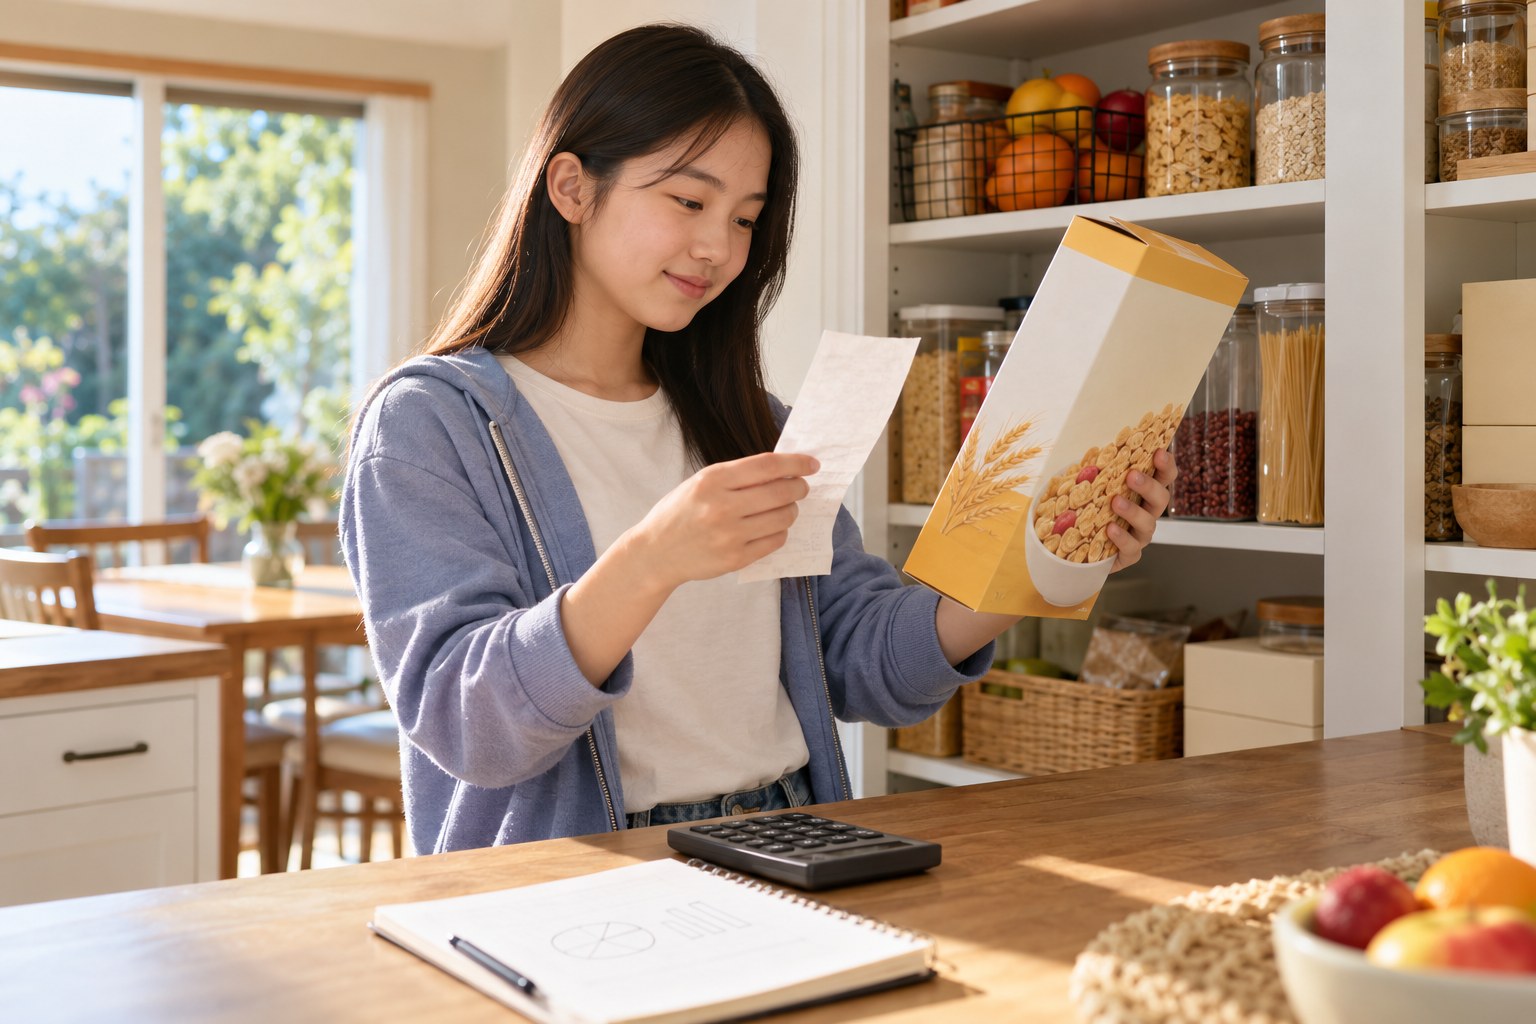
Your teen digs up an old receipt or asks a relative what everyday items cost years ago, compares those prices with today's shelf prices and calculates each item's average annual percent increase. Using two price points, they build exponential models such as f(t) = 1.00(1.0407)^t, predict prices ten years out and figure out what that means for the buying power of a $20 bill.
Objective
Your teen will construct exponential functions from two input-output pairs, interpret the growth factor as an annual inflation rate and use the models to make predictions.
Standards
F-LE.2Math · Grade HS · High School: Functions — Linear, Quadratic & Exponential Models Construct linear and exponential functions, including arithmetic and geometric sequences, given a graph, a description of a relationship, or two input-output pairs (include reading these from a table).
Materials
| Item | Quantity |
|---|
| Old receipt, old ad or a relative's remembered prices for at least 3 items | 1 |
| Pantry items to check current prices (such as cereal, a snack bar or bread) | 3 |
| Phone or computer for current prices if needed | 1 |
| Calculator with an exponent key (or phone calculator turned sideways) | 1 |
| Notebook | 1 |
| Pencil | 1 |
Vocabulary
Inflation
A general rise in prices over time, which means each dollar buys less.
Growth factor
The number you multiply by each period in an exponential model; a 4 percent yearly increase has a growth factor of 1.04.
Annual percent increase
The average rate at which a price grew each year, found from the growth factor minus 1.
Buying power
How much a fixed amount of money can buy at a given time.
Preparation
- Hunt for an old receipt in a drawer or box, or call a grandparent and ask what three everyday items cost in a year they remember.
- Line up 3 matching pantry items so your teen can read current prices from the receipt or store app.
Introduction
Hand your teen the old receipt. Ask: if this snack cost a dollar ten years ago and costs $1.49 now, did it go up 49 percent, or about 5 percent a year, or something else? Today they find out exactly how to tell.
What's one thing you buy that you've noticed getting more expensive?
If prices go up the same percent every year, will the dollar amount go up the same each year? Why or why not?
Steps
1Step 1
Collect two price points
(10 min) Your teen writes at least 3 items in the notebook with an old price and year from the receipt or relative, and a current price and year from the pantry items' receipt, store app or website. Remind them to compare the same size, since packages often shrink.
2Step 2
Find percent change
(8 min) For each item your teen calculates the total percent change with the calculator: (new - old) / old x 100. They predict whether dividing by the number of years gives the true yearly rate and note their guess in the notebook.
3Step 3
Build exponential models
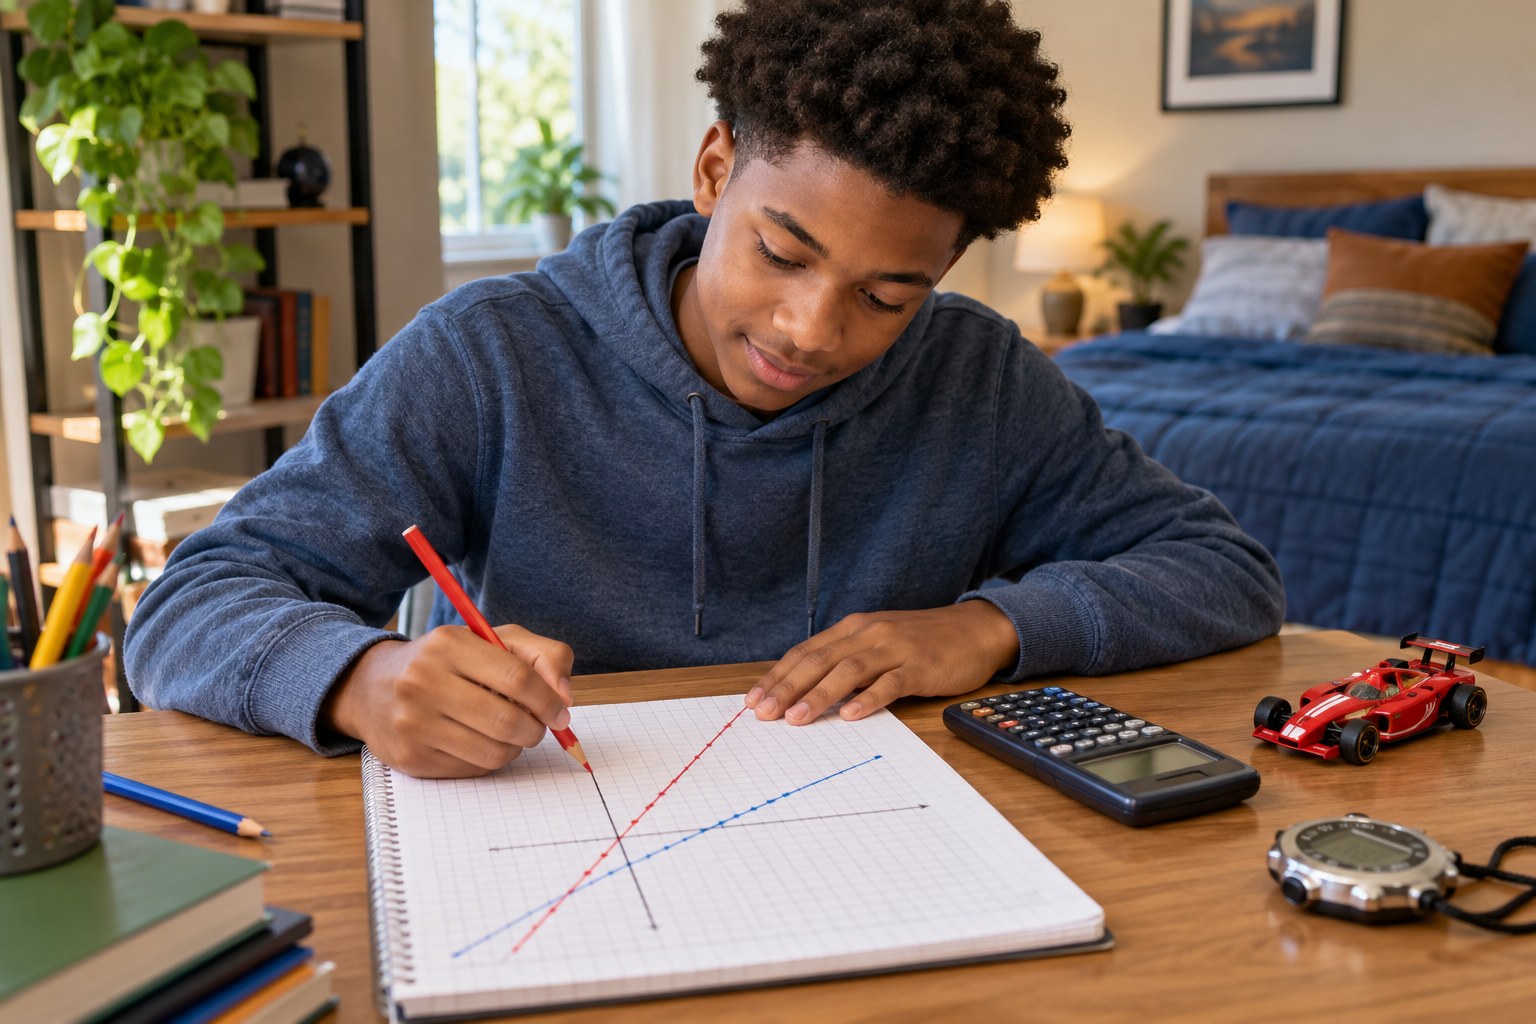
(15 min) Your teen works the Sample Items in Additional Sections first: they set up f(t) = a(1 + r)^t, plug in the old price as a and the current price at the right t, and solve for the growth factor by taking the root, such as (1.49)^(1/10) = 1.0407. Then they build a model for each of their own items and write each as a function in the notebook.
4Step 4
Predict the future
(10 min) Using each model, your teen predicts each item's price ten years from now with the calculator and writes how much a $20 bill could buy then compared with now. They compare their item's yearly rate with the 2 to 3 percent yearly inflation many central banks aim for and talk about why snack prices might rise faster or slower.
5Step 5
Check the key
(5 min) Your teen checks the Practice Problems against the Answer Key and explains to you why dividing total percent change by the years overstates the yearly rate for compound growth. They circle the item with the fastest inflation.
Conclusion
Ask: 'If your savings sit in a jar while prices rise about 4 percent a year, what happens to them?' Exponential growth works against cash in a jar and for money that earns interest.
Make your own lesson plan in minutes
Describe a topic and Resource Portal AI writes the objectives, materials and steps for your group.
Try Resource Portal AI