Lesson planCricket Thermometer: Modeling Chirp Rate as a Linear Function
Math45 minutesGrades: 8th
Overview
Use cricket chirps to model temperature with a linear function.
Description
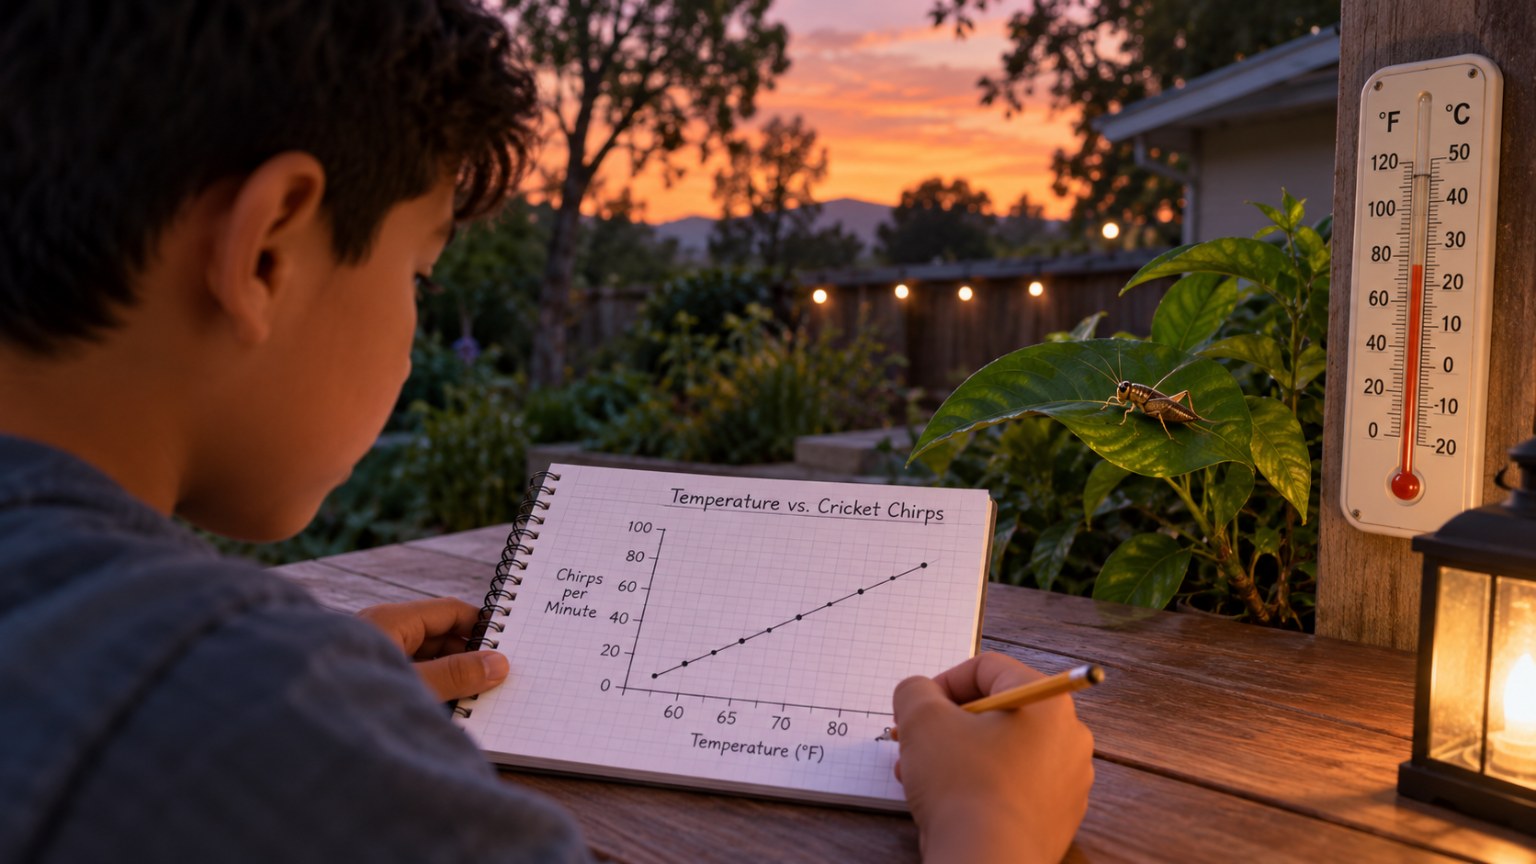
Your teen uses Dolbear's law, a 19th-century rule relating cricket chirp rate to air temperature, to build a linear function from data, interpret its slope and initial value, compare it with a folk 'count for 14 seconds' rule, and (on a warm evening) test it against a real thermometer.
Objective
Your teen will construct a linear function from data and from a verbal rule, interpret the rate of change and initial value in context, and compare two functions represented in different ways.
Standards
8.F.2Math · Grade 8 · Functions Compare properties of two functions each represented in a different way (algebraically, graphically, numerically in tables, or by verbal descriptions).
8.F.4Math · Grade 8 · Functions Construct a function to model a linear relationship between two quantities. Determine the rate of change and initial value of the function from a description of a relationship or from two (x, y) values, including reading these from a table or from a graph. Interpret the rate of change and initial value of a linear function in terms of the situation it models, and in terms of its graph or a table of values.
Materials
| Item | Quantity |
|---|
| Graph paper or a graphing app | 2 sheets |
| Pencil, ruler and calculator | 1 each |
| Sample data table (below) | 1 |
| Outdoor thermometer or a weather app with local temperature | 1 |
| Phone stopwatch for counting chirps on a warm evening | 1 |
Vocabulary
Rate of change
How much the output changes for each one-unit increase in the input; the slope.
Initial value
The output when the input is zero; the y-intercept.
Linear function
A function whose graph is a straight line, written y = mx + b.
Ectotherm
An animal whose body temperature and activity depend on the outside temperature.
Preparation
- Copy the sample data table and the folk rule below onto paper.
- If you hear crickets in the evening, plan to step outside for 5 minutes with a stopwatch and a thermometer or weather app.
Introduction
Ask: 'Have you noticed that crickets chirp faster on hot nights and slower on cool ones? In 1897 a physicist named Amos Dolbear published a formula for turning chirps into a temperature.'
Why would an insect's chirp speed depend on the weather?
What would a graph of chirps versus temperature look like if the relationship were linear?
Steps
1Step 1
Graph the sample data
(9 min) Your teen plots the sample data with chirps per minute on the x-axis and temperature in °F on the y-axis. They decide whether the points look close to a straight line.
2Step 2
Build the function
(10 min) Using two points, such as (96, 64) and (161, 80), your teen finds the slope and the y-intercept and writes the function T = mN + b. They compare it with Dolbear's published rule T = 40 + N/4 and explain what the slope of 1/4 means: the temperature rises about 1 °F for every 4 extra chirps per minute.
3Step 3
Interpret the intercept
(6 min) Your teen explains what the initial value of 40 °F would mean in context and why it does not make biological sense, since crickets stop chirping in cold weather well above 40 °F. Discuss that models only work within a range of inputs.
4Step 4
Compare the folk rule
(10 min) A common rule says to count chirps in 14 seconds and add 40. Your teen rewrites this as a function of chirps per minute, T = 40 + (14/60)N, then compares its rate of change and outputs with Dolbear's rule at 80, 120 and 160 chirps per minute.
5Step 5
Field test
(8 min) On a warm evening, your teen counts real cricket chirps for 15 seconds, three times, and averages them. They predict the temperature with both rules and compare with the thermometer or weather app, or use the backup data if no crickets are chirping.
Conclusion
Ask: 'Which rule predicted better, and why might neither be exact?' Repeat the field test on a cooler night and add your points to the graph.
Make your own lesson plan in minutes
Describe a topic and Resource Portal AI writes the objectives, materials and steps for your group.
Try Resource Portal AI